 Global| Aug 23 2005
U.S. Existing Home Sales & Prices Moderate Slightly in July
Summary
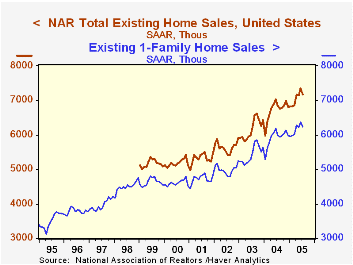
Existing home sales eased slightly in July, falling 2.6% to 7.16 million units from an upwardly revised 7.35 million in June. Single-family sales alone decreased by 2.3% to 6.24 million and condo and co-op sales by 4.2% to 920,000. [...]
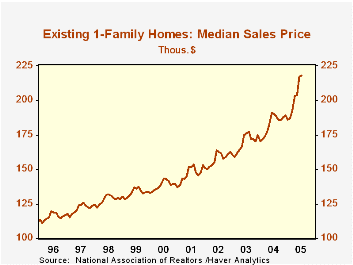 The median price of an existing single-family home increased 0.5% but June's price figure was revised downward, so the July result, at $217,900, is actually lower than the original June price median. Prices are not seasonally adjusted, and they tend to soften a bit as the summer winds down. Even so, the July number is still 14.1% ahead of a year ago, and the escalation should be plainly evident in our second graph.
By region, total sales fell everywhere except in the South, where they were flat with June. The West saw a decrease of 7% in the month to a volume just 0.7% above July 2004. Sales in the Midwest eased 1.4%, making them 1.9% below last July, and those in the Northeast were off 2.3%, but still held a gain of 4.9% from the year earlier amount.
The median price of an existing single-family home increased 0.5% but June's price figure was revised downward, so the July result, at $217,900, is actually lower than the original June price median. Prices are not seasonally adjusted, and they tend to soften a bit as the summer winds down. Even so, the July number is still 14.1% ahead of a year ago, and the escalation should be plainly evident in our second graph.
By region, total sales fell everywhere except in the South, where they were flat with June. The West saw a decrease of 7% in the month to a volume just 0.7% above July 2004. Sales in the Midwest eased 1.4%, making them 1.9% below last July, and those in the Northeast were off 2.3%, but still held a gain of 4.9% from the year earlier amount.
The latest release from the National Association of Realtors is available here.
| Existing Home Sales (000, AR) | July | June | Y/Y | 2004 | 2003 | 2002 |
|---|---|---|---|---|---|---|
| Total Home Sales | 7,160 | 7,350 | 1.3% | 6,723 | 6,170 | 5,653 |
| Single Family Home Sales | 6,220 | 6,390 | 0.5% | 5,913 | 5,441 | 4,995 |
| Single Family Median Home Price ($,000) | $217.9 | $216.7 | 14.6% | $182.8 | $169.1 | $157.6 |
by Carol Stone August 23, 2005
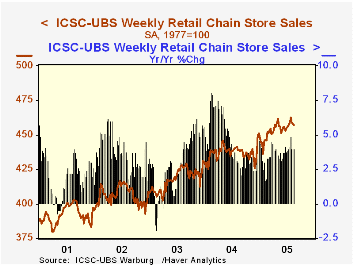
The ICSC-UBS retail chain-store sales index is constructed using the same-store sales (stores open for one year) reported by 78 stores of seven retailers: Dayton Hudson, Federated, Kmart, May, J.C. Penney, Sears and Wal-Mart.
| ICSC-UBS (SA, 1977=100) | 08/20/05 | 08/13/05 | Y/Y | 2004 | 2003 |
|---|---|---|---|---|---|
| Total Weekly Chain Store Sales | 456.8 | 458.0 | 4.0% | 4.6% | 2.9% |
by Louise Curley August 23, 2005
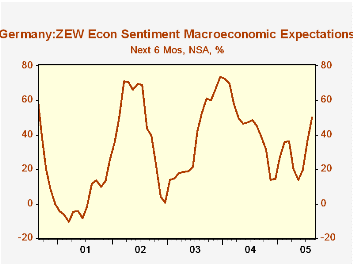
The ZEW Center for European Research announced that the institutional investors and analysts who respond to their survey on current and future conditions in Germany turned surprisingly optimistic in August as shown in the first chart. The balance of those expecting improved conditions in the next six months over those expecting worsened conditions rose to 50% from 37% in July. This was well above consensus and was the highest balance of optimists since March 2004. The recent decline in the euro has been one factor in the increase in confidence but there is also some suggestion that domestic activity within the economy is stirring. 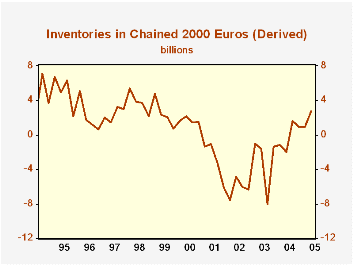
Such evidence is found in the details of the second quarter German gross domestic product released today. Investment in real terms both in plant and equipment and inventories rose and managed to overcome a decline in net exports and continued sluggish consumption. Total GDP increased a mere 0.01% in the quarter. The strongest rise was in inventories. Inventory liquidation has long been a drag on the German economy and the recent accumulation is encouraging, suggesting as it does that businesses are beginning to be more optimistic about future prospects.
In the German national accounts, inventories are shown only in current dollars. We derived a series in chained 2000 euros, by subtracting fixed investment from total investment, both in chained 2000 euros. This is not a proper procedure when dealing with chained dollars, however, it may suffice to give a rough estimate of the actual trend in real terms. The result is shown in the second chart.
| Germany | Aug 05 | Jul 05 | Aug 04 | M/M dif | Y/Y dif | 2004 | 2003 | 2002 |
|---|---|---|---|---|---|---|---|---|
| ZEW % balance | 50.0 | 37.0 | 45.3 | 13.0 | 4.7 | 44.6 | 38.4 | 45.3 |
| Billions Chained 2000 Euros | Q2 05 | Q1 05 | Q2 04 | M/M % | Y/Y % | 2004 Quarterly Avg |
2003 Quarterly Avg | 2002 Quarterly Avg |
| Total Gross Domestic Product | 531.56 | 531.51 | 528.41 | 0.01 | 0.60 | 527.87 | 522.15 | 523.14 |
| Final Consumption | 406.36 | 406.64 | 406.60 | -0.07 | -0.06 | 407.28 | 408.22 | 407.72 |
| Total Investment | 100.16 | 98.15 | 98.20 | 2.05 | 2.00 | 98.19 | 96.81 | 94.36 |
| Fixed Investment | 97.40 | 97.23 | 97.90 | 0.17 | -0.51 | 98.32 | 99.83 | 100.56 |
| Inventory (derived) | 2.76 | 0.92 | 0.30 | 1.84* | 2.46* | -0.13 | -3.02 | -6.20 |
| Exports | 222.30 | 219.63 | 214.38 | 1.22 | 3.69 | 212.41 | 196.13 | 191.71 |
| Imports | 197.21 | 192.80 | 188.21 | 2.29 | 4.62 | 190.08 | 179.15 | 170.71 |
Carol Stone, CBE
AuthorMore in Author Profile »Carol Stone, CBE came to Haver Analytics in 2003 following more than 35 years as a financial market economist at major Wall Street financial institutions, most especially Merrill Lynch and Nomura Securities. She had broad experience in analysis and forecasting of flow-of-funds accounts, the federal budget and Federal Reserve operations. At Nomura Securities, among other duties, she developed various indicator forecasting tools and edited a daily global publication produced in London and New York for readers in Tokyo. At Haver Analytics, Carol was a member of the Research Department, aiding database managers with research and documentation efforts, as well as posting commentary on select economic reports. In addition, she conducted Ways-of-the-World, a blog on economic issues for an Episcopal-Church-affiliated website, The Geranium Farm. During her career, Carol served as an officer of the Money Marketeers and the Downtown Economists Club. She had a PhD from NYU's Stern School of Business. She lived in Brooklyn, New York, and had a weekend home on Long Island.
More Economy in Brief


