Global| Jul 02 2020
U.S. Employment Continues to Increase in June, Lowering Jobless Rate
by:Tom Moeller
|in:Economy in Brief
Summary
• Rise in jobs is broad-based amongst industries. • Earnings weaken for second straight month. • Unemployment rate, though still double-digit, declines to three-month low. The job market improved again in June. Nonfarm payroll [...]


• Rise in jobs is broad-based amongst industries.
• Earnings weaken for second straight month.
• Unemployment rate, though still double-digit, declines to three-month low.
The job market improved again in June. Nonfarm payroll employment increased 4.800 million (-8.7% y/y) after rising 2.699 million in May, revised from 2.509 million. A 3.090 million increase had been expected in the Action Economics Forecast Survey.
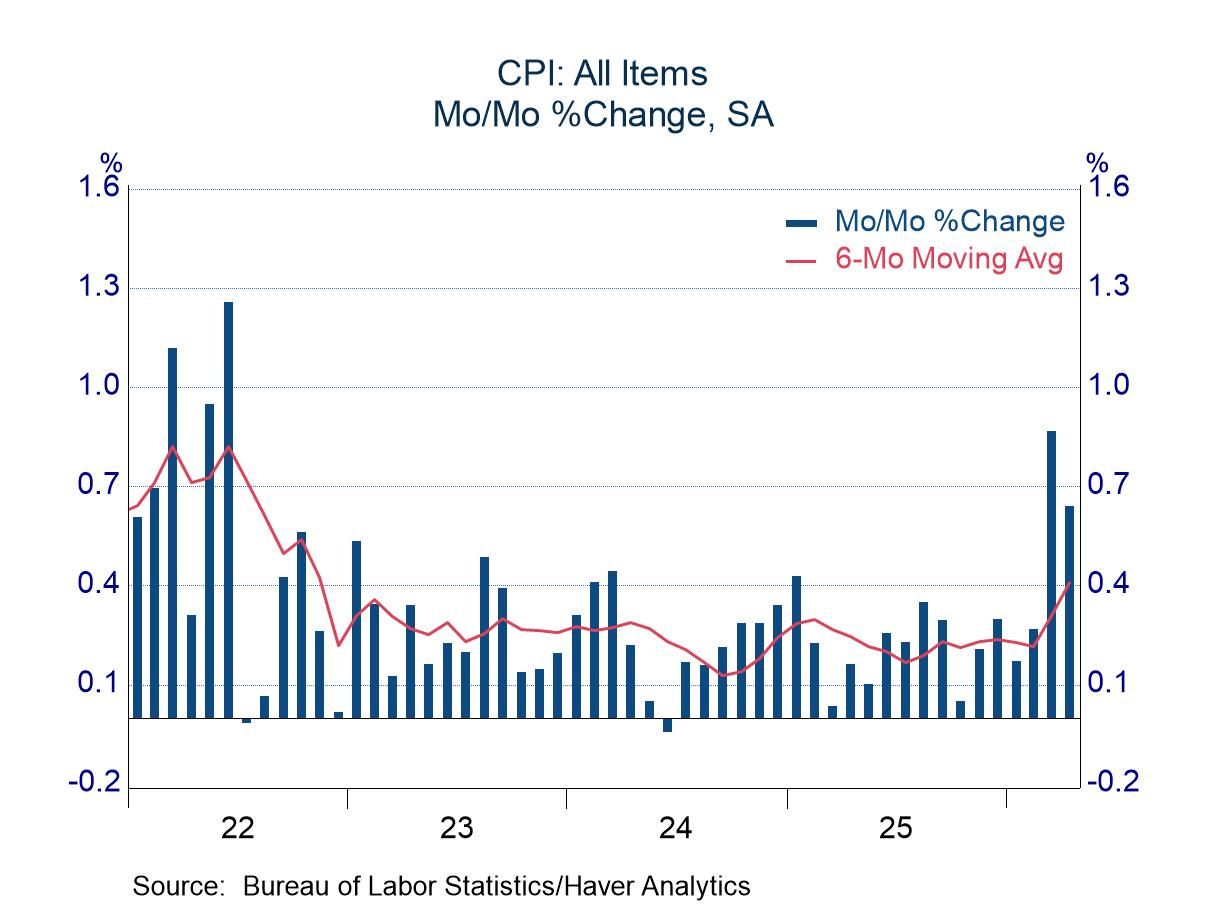
Average hourly earnings declined 1.2% (+5.0% y/y) as leisure & hospitality and factory sector earnings dropped sharply.
The unemployment rate fell to 11.1% from 13.3%. A lesser decline to 12.3% had been expected. Employment in the household survey increased 4.940 million after rising 3.839 million in May while the labor force rose 1.705 million after increasing 1.746 million. The overall jobless rate, including those who were marginally attached or working part-time for economic reasons, declined to 18.0% from 21.2%.
The employment & earnings data are collected from surveys taken each month during the week containing the 12th of the month.
From the payroll employment survey, the 4.800 million rise in jobs overall reflected a 356,000 increase (-5.8% y/y) in factory sector jobs, the second straight monthly rise. Construction employment improved 158,000 (-4.4% y/y), down from the May increase of 453,000, but still continuing to recover after the 1.0 million plunge in April. Employment in the mining & logging sector fell 10,000 (-17.2% y/y).
The number of private service jobs increased 4.263 million (-9.9% y/y) reflecting a 2.088 million increase (-27.1% y/y) in leisure & hospitality employment. The number of education & health jobs rose 568,000 (-5.7% y/y) while professional & business service sector employment gained 306,000 (-7.4% y/y). Temporary help jobs jumped 148,900 (-23.8% y/y).


The decline in average hourly earnings in the private sector was led by the leisure & hospitality sector where earnings fell 2.3% (+2.7% y/y). Factory sector pay dropped 1.6% (+3.2% y/y). Trade, transportation & utilities earnings fell 0.9% (+4.0% y/y) and professional & business service sector earnings fell 0.8% (+4.5% y/y). These declines were offset by a 1.2% increase (6.1% y/y) in financial sector earnings and a 0.4% rise (2.9% y/y) in construction sector pay.
 The length of the average workweek shortened to 34.5 hours,
reversing some of the prior month's extension to 34.7 hours. Mining &
logging hours improved slightly to 43.3 and construction hours rose to 38.9. The
length of the factory sector workweek rose to 39.2 hours from 38.0 in April and
38.7 in May, but remained notably below the 40+ hours that characterized the
month prior to the pandemic. Private service sector hours shortened, however, to
33.6 after surging to 33.8 in May. That came despite a notable lengthening of
education & health service sector hours to 33.1. Professional & business
service sector hours eased to 36.3 while information sector hours slipped to 36.5.
The length of the average workweek shortened to 34.5 hours,
reversing some of the prior month's extension to 34.7 hours. Mining &
logging hours improved slightly to 43.3 and construction hours rose to 38.9. The
length of the factory sector workweek rose to 39.2 hours from 38.0 in April and
38.7 in May, but remained notably below the 40+ hours that characterized the
month prior to the pandemic. Private service sector hours shortened, however, to
33.6 after surging to 33.8 in May. That came despite a notable lengthening of
education & health service sector hours to 33.1. Professional & business
service sector hours eased to 36.3 while information sector hours slipped to 36.5.
From the household survey, the decline in the unemployment rate to 11.1% occurred as the labor force participation rate improved to 61.5% from 60.8%, after collapsing to 60.2% in April. The teenage participation rate eased to 32.3% after rising to 33.9%, and for those aged 20-24, it improved to 67.0% after rising slightly to 66.0%. For workers aged 25-54, the rate recovered further to 81.5% after rising to 80.7%, following a sharp decline to 79.9% in April. For men aged 25-54, the rate rose to 87.9% after rising to 87.2%. For women of that age, it rose to 75.4%, but remained well below its February record high of 77%. For workers aged 55 & over, the participation rate improved to a depressed 39.0%.
The employment/population ratio for all workers rose to 54.6% from 52.8% in May, but remained sharply lower than the recent high of 61.2% in January.
The teenage unemployment rate declined to 23.2% and remained below the record 31.9% in April but still much higher than February's 5.7%. The rate for workers aged 20-24 fell to 19.8%, down from the April record of 25.7%. For workers aged 25-54, the rate fell sharply to 9.8% from 11.5%. For those over 55, the jobless rate declined to 9.7%, down from the record 13.6% in April.
By educational attainment, unemployment of workers without a high school diploma was 16.6% in June, down from 21.2% in April. High school graduates without any college were 12.1% unemployed last month, down from 17.3% in April but still up from 4.4% in March. Those with some college but no degree were 10.9% unemployed, still up from a near-record low of 2.7% in December. College graduates were 6.9% unemployed, increased from a 1.9% low in February.
The Department of Labor published this note due to the simultaneous release of the employment report and unemployment insurance claims.
The labor market data are contained in Haver's USECON database. Detailed figures are in the EMPL and LABOR databases. The expectations figures are in the AS1REPNA database.


| Employment: (SA, M/M Change, 000s) | Jun | May | Apr | Jun Y/Y | 2019 | 2018 | 2017 |
|---|---|---|---|---|---|---|---|
| Payroll Employment | 4,800 | 2,699 | -20,787 | -8.7% | 1.4% | 1.6% | 1.6% |
| Previous Estimate | -- | 2,509 | -20,687 | -- | -- | -- | -- |
| Manufacturing | 356 | 250 | -1,317 | -5.8 | 1.2 | 2.0 | 0.7 |
| Construction | 158 | 453 | -1,018 | -4.4 | 2.8 | 4.6 | 3.6 |
| Private Service-Producing | 4,263 | 2,548 | -17,447 | -9.9 | 1.4 | 1.5 | 1.8 |
| Government | 33 | -533 | -952 | -5.7 | 0.6 | 0.5 | 0.4 |
| Average Weekly Hours - Private Sector | 34.5 | 34.7 | 34.2 | 34.4 | 34.4 | 34.5 | 34.4 |
| Private Sector Average Hourly Earnings (%) | -1.2 | -1.0 | 4.7 | 5.0 | 3.3 | 3.0 | 2.6 |
| Unemployment Rate (%) | 11.1 | 13.3 | 14.7 | 3.7 | 3.7 | 3.9 | 4.3 |

Tom Moeller
AuthorMore in Author Profile »Prior to joining Haver Analytics in 2000, Mr. Moeller worked as the Economist at Chancellor Capital Management from 1985 to 1999. There, he developed comprehensive economic forecasts and interpreted economic data for equity and fixed income portfolio managers. Also at Chancellor, Mr. Moeller worked as an equity analyst and was responsible for researching and rating companies in the economically sensitive automobile and housing industries for investment in Chancellor’s equity portfolio. Prior to joining Chancellor, Mr. Moeller was an Economist at Citibank from 1979 to 1984. He also analyzed pricing behavior in the metals industry for the Council on Wage and Price Stability in Washington, D.C. In 1999, Mr. Moeller received the award for most accurate forecast from the Forecasters' Club of New York. From 1990 to 1992 he was President of the New York Association for Business Economists. Mr. Moeller earned an M.B.A. in Finance from Fordham University, where he graduated in 1987. He holds a Bachelor of Arts in Economics from George Washington University.
More Economy in Brief