 Global| Nov 14 2011
U.S. Economic Activity Has Been In A Slow-Growth Mode
by:Tom Moeller
|in:Economy in Brief
Summary
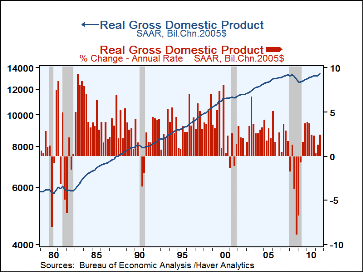
Gross Domestic Product is the broadest measure of the economy's performance. Adjusted for prices, GDP bottomed in Q2'09 following a business cycle downturn that was the most severe since the Great Depression. Since its trough, GDP [...]
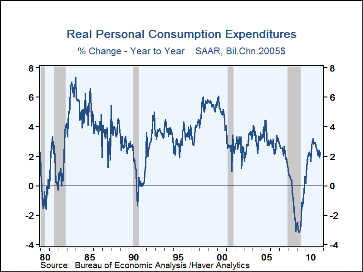
Gross Domestic Product is the broadest measure of the economy's performance. Adjusted for prices, GDP bottomed in Q2'09 following a business cycle downturn that was the most severe since the Great Depression. Since its trough, GDP growth has averaged 2.5% while the level has increased 5.6%. However, last quarter's level barely surpassed its Q4'07 peak. By historical standards, this performance is horrendous. During earlier business cycles, it took only one-to-three quarters before GDP recovered its pre-recession peak. By component, while real personal consumption growth has turned positive, its 2.2% growth rate since the recession's end is below the 4-6% rates following earlier severe recessions. Business investment has grown relatively faster. However, the level of activity also remains well below its pre-recession peak versus the norm for recovery of less than two years. And then there's residential building. It continues to wallow at its recession low instead of rising sharply, as usual, after the trough. Foreign trade & inventories have performed reasonably well, but budget deficits are causing government spending to atypically fall.
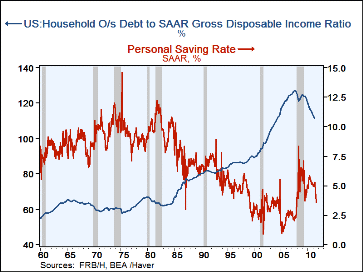
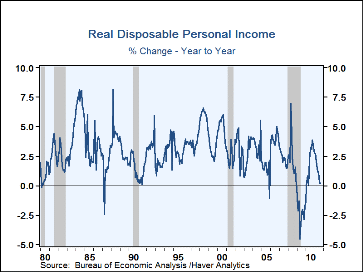
Focusing on the consumer, behind the subpar personal consumption growth is weak real disposable income. It fell at a 1.7% annual rate in Q3 and its level just equaled Q4'10. To fuel spending, consumers have drawn down savings. The September savings rate fell to 3.6%, its lowest since early-2008, from the recent high near 6%. These rates stand in marked contrast to the 7.0% averaged during the last 50 years. The good news is that a deleveraging of the consumer balance sheet is underway. As of last quarter, household debt had fallen to 112% of disposable income, down from 127% at its 2007 peak. However, that figure still was roughly double the postwar norm, as calculated by Haver Analytics.
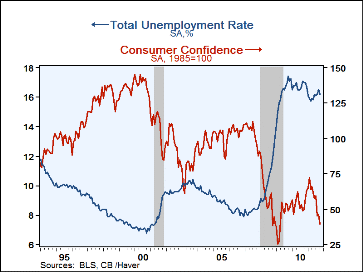
Consumers don't feel great, so their spending isn't robust. Consumer Sentiment, as tabulated by the University of Michigan, as well as Consumer Confidence, published by the Conference Board, are two measures of how consumers sense well being. As such, while the mid-November Sentiment reading was up m/m, the level was only moderately above its recession trough. The same was true of Confidence, though recently Confidence actually reversed course and headed down again. What explains this discouragement is straight forward: Incomes remain under pressure while unemployment remains high. And when consumers aren't upbeat, they don't spend freely.
A poor labor market accounts for this lousy feeling. Two years after the economic trough, the unemployment rate is barely off its high and stuck near 9%, still at its highest since the 1981-82 recession. Following that recession it fell to just-above 7% in two years. The same was true following the severe 1973-75 recession.Several other labor market indicators reflect this terrible performance.
- Nonfarm payroll growth of 1.2% during the last year compares to 2%-to-5% rates of growth following past recessions.
- The total unemployment rate of 16.2%, including persons who are marginally attached or working part-time for economic reasons, is a record.
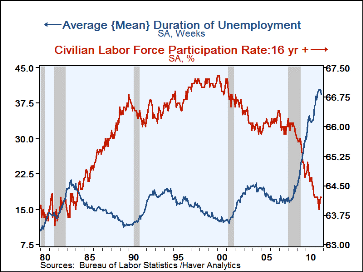
- The average duration of unemployment has risen to a record 39 weeks.
- Discouraged workers have exited the labor force and pulled the overall labor force participation rate to its lowest level (64%) since 1983.
With luck, the above reflects the worst before a true economic recovery. The Conference Board's Index of Leading Indicators is rising and vehicle sales are up. Furthermore, interest rates are at historic lows, the yield curve is steep (lots of liquidity) and fiscal stimulus has been aggressive. Also, the low foreign exchange value of the dollar is bolstering U.S. competitiveness and the level of inventories versus GDP is near its record low. Paradoxically, many of these factors have been in place for some time with no pickup in growth. The timing of a steadier pick-up in growth is still a question mark.
Subsidizing Job Creation in the Great Recession from the Federal Reserve Bank of New York is available here.
| 10-Year Average Growth (%) | 2010 | 2000 | 1990 | 1980 | 1970 | 1960 |
|---|---|---|---|---|---|---|
| Real GDP | 1.6 | 3.4 | 3.2 | 3.2 | 4.2 | 3.5 |
| Real Disposable Income | 2.1 | 3.3 | 3.2 | 3.3 | 4.7 | 3.4 |
| Payroll Employment | -0.2 | 1.9 | 1.9 | 2.5 | 2.7 | 1.8 |
| Saving Rate (%) | 5.3 | 2.9 | 6.5 | 9.8 | 9.4 | 7.2 |
Tom Moeller
AuthorMore in Author Profile »Prior to joining Haver Analytics in 2000, Mr. Moeller worked as the Economist at Chancellor Capital Management from 1985 to 1999. There, he developed comprehensive economic forecasts and interpreted economic data for equity and fixed income portfolio managers. Also at Chancellor, Mr. Moeller worked as an equity analyst and was responsible for researching and rating companies in the economically sensitive automobile and housing industries for investment in Chancellor’s equity portfolio. Prior to joining Chancellor, Mr. Moeller was an Economist at Citibank from 1979 to 1984. He also analyzed pricing behavior in the metals industry for the Council on Wage and Price Stability in Washington, D.C. In 1999, Mr. Moeller received the award for most accurate forecast from the Forecasters' Club of New York. From 1990 to 1992 he was President of the New York Association for Business Economists. Mr. Moeller earned an M.B.A. in Finance from Fordham University, where he graduated in 1987. He holds a Bachelor of Arts in Economics from George Washington University.
More Economy in Brief
 Global| Feb 05 2026
Charts of the Week: Balanced Policy, Resilient Data and AI Narratives
by:Andrew Cates


