 Global| Jun 24 2009
U.S. Durable Goods OrdersSurprisingly Strong For A Second Month
by:Tom Moeller
|in:Economy in Brief
Summary
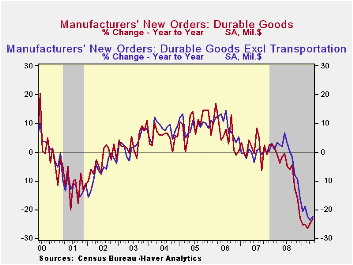
The factory sector is showing some life recently and may be emerging from the moribund state of the last year. The May report of durable goods orders indicated a 1.8% jump following a little-revised 1.8% April gain. The latest [...]
 The factory
sector is showing some life recently and may be emerging from the
moribund state of the last year. The May report of durable goods orders
indicated a 1.8% jump following a little-revised 1.8% April gain. The
latest increase easily outpaced Consensus expectations for a
0.8% decline and during the last three months orders have risen at a
5.3% annual rate. That follows a 5.8% decline during all of
last year.
The factory
sector is showing some life recently and may be emerging from the
moribund state of the last year. The May report of durable goods orders
indicated a 1.8% jump following a little-revised 1.8% April gain. The
latest increase easily outpaced Consensus expectations for a
0.8% decline and during the last three months orders have risen at a
5.3% annual rate. That follows a 5.8% decline during all of
last year.
A 3.6% rise (-25.8% y/y) in transportation equipment orders led last month's increase in total durables bookings. That followed a 6.2% rise during April. Higher orders for commercial aircraft led the gain with a 68.1% (-47.7% y/y) surge. Conversely, orders for motor vehicles & parts fell 8.1% (-29.3% y/y) as the auto companies continued to suffer the effects of weak sales. Machinery orders also posted a notable 7.7% increase (-26.9% y/y) after slight uptick in April but electrical equipment orders fell 1.1% (-27.0% y/y) after little change during April. Orders for primary metals rose slightly for the second month but were off by nearly one-half from the year-ago level. Orders for computers & electronic products reversed most of their April decline as computer orders rose 9.4% (-20.2% y/y) but orders for communications equipment slipped m/m and have moved sideways this year.
 The
capital goods sector may have begun to show life.
Orders for nondefense capital goods recovered an April decline with a
4.8% gain due to the jump in aircraft orders noted above. Nondefense
orders excluding aircraft also firmed but by just enough to return to
the level of last February. During the last ten years there has been an
80% correlation between the y/y change in nondefense capital goods
orders and the change in equipment & software spending in the
GDP accounts. The correlation of the GDP figure with capital goods
shipments is, as one would expect, a larger 92%.
The
capital goods sector may have begun to show life.
Orders for nondefense capital goods recovered an April decline with a
4.8% gain due to the jump in aircraft orders noted above. Nondefense
orders excluding aircraft also firmed but by just enough to return to
the level of last February. During the last ten years there has been an
80% correlation between the y/y change in nondefense capital goods
orders and the change in equipment & software spending in the
GDP accounts. The correlation of the GDP figure with capital goods
shipments is, as one would expect, a larger 92%.
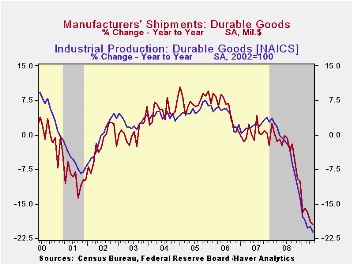
As might be expected, the improvement in orders has yet to show up in higher shipments. Shipments of durable goods fell 2.1% last month (-19.5% y/y) and have fallen in each month since February of last year. That y/y decline in shipments has been accompanied by a 21.1% y/y drop in industrial production of durable goods. During the last ten years, there has been an 80% correlation between the change in shipments of durable goods and the change in durables industrial production.
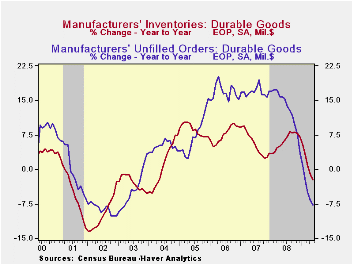 Inventories
of durable goods fell for the fifth
consecutive month. The 0.8% decline followed a 1.1% April decline that
was deeper than reported initially. On a three-month basis decumulation
of durable goods inventories has been at a near-record 13.5% rate.
Quick decumulation of inventories has been notably across industries.
Backlogs in order books have fallen in each of the last eight months
and during the last year by 7.7%, a rate of decline which is the
sharpest since 2003.
Inventories
of durable goods fell for the fifth
consecutive month. The 0.8% decline followed a 1.1% April decline that
was deeper than reported initially. On a three-month basis decumulation
of durable goods inventories has been at a near-record 13.5% rate.
Quick decumulation of inventories has been notably across industries.
Backlogs in order books have fallen in each of the last eight months
and during the last year by 7.7%, a rate of decline which is the
sharpest since 2003.
The durable goods figures are available in Haver's USECON database.
Taming the Credit Cycle by Limiting High-Risk Lending from the Federal Reserve Bank of Dallas is available here.
| NAICS Classification (%) | May | April | Y/Y | 2008 | 2007 | 2006 |
|---|---|---|---|---|---|---|
| Durable Goods Orders | 1.8 | 1.8 | -23.3 | -5.8 | 1.4 | 6.2 |
| Excluding Transportation | 1.1 | 0.4 | -22.4 | -1.2 | -0.3 | 9.1 |
| Nondefense Capital Goods | 10.0 | -2.9 | -26.9 | -6.8 | 3.5 | 9.4 |
| Excluding Aircraft | 4.8 | -2.9 | -21.8 | -0.3 | -2.7 | 10.7 |
by Robert Brusca June 24, 2009
Consumer confidence in Italy has risen firmly in June.
Confidence now has risen in five of the past seven months having fallen
in only one of those months. The trend to improvement is clear. The
overall confidence measure from ISAE is not in the 35th percentile of
its range- still quiet weak but not so disastrous.
The overall situation in the past 12 months is given a rating
of -68 which sounds terrible. Actually that reading is in the 55th
percentile of its range of historic outcomes and stands above the
average response of -71. For the next 12-months the rating is in the
40th percentile of range and is only slightly below the average
response for that category. It’s a return to sub-normalcy.
The ability to make major purchase right now is at the index
average, but the mid point of its range at the 43.9th range percentile.
For the future the response rate is a super strong 95th percentile
reading.
Despite this improved news, fears of unemployment still rate
high in 66th percentile of their range but even higher when we look at
the ranking percentile. The latter measure tells how many responses are
below the current response: that percentage is 96.2%. In other words,
unemployment fears are worse than this only about FOUR percent of the
time. Still the range reading tells us that there have been times when
the fears were much, much, greater. The ranking percentile says yes,
that maybe so, but there have not been many of those times. We can
compare the ranking and the range percentiles for each response to get
a better fix on what the raw responses man. Cleary the raw responses
taken alone can be very misleading across categories.
As you can tell by surveying these responses and looking at
the percentile ranges or rankings each category has its individual
distribution of responses. Over the past 200-some months the overall
situation reading averages a -71 reading while the ‘overall situation
for the next 12-months’ averages a -9. Go figure. Are 12-monht periods
usually that different? I don’t think so. We use the percentile and
range readings to try to shift though these responses to get a more
accurate assessment of the consumer’s mood.
For now it is apparent that there is an improvement in the
Italian consumer’s mood, and also some paradox. There is still a high
fear of unemployment but apparently the social safety network is good
enough that is not raising a lot of anxiety about the future or even
about the ability to spend on consumer items. That may seem unusual but
after all this is Europe and it’s Italy. Those are simply the facts.
| Italy ISAE Consumer Confidence | |||||||
|---|---|---|---|---|---|---|---|
| Since Jan 1992 Rank | |||||||
| Jun-09 | May-09 | Apr-09 | Mar-09 | Percentile | Rank | percentile | |
| Consumer Confidence | 105.4 | 104.9 | 104.9 | 99.9 | 35.0 | 148 | 28.8% |
| Last 12 months | |||||||
| OVERALL SITUATION | -68 | -73 | -74 | -84 | 63.2 | 93 | 55.3% |
| PRICE TRENDS | -40.5 | -45 | -43 | -45 | 9.3 | 205 | 1.4% |
| Next 12months | |||||||
| OVERALL SITUATION | -8 | -17 | -26 | -35 | 49.2 | 123 | 40.9% |
| PRICE TRENDS | 8.5 | 10 | 9.5 | 7 | 17.3 | 101 | 51.4% |
| UNEMPLOYMENT | 15 | 17 | 21 | 38 | 66.2 | 8 | 96.2% |
| HOUSEHOLD BUDGET | 0 | 5 | 1 | 5 | 15.6 | 200 | 3.8% |
| HOUSEHOLD FIN SITUATION | |||||||
| Last 12 months | -37 | -34 | -37 | -39 | 38.8 | 126 | 39.4% |
| Next12 months | -4 | -5 | -11 | -10 | 63.3 | 117 | 43.8% |
| HOUSEHOLD SAVINGS | |||||||
| Current | 60 | 59 | 60 | 69 | 72.7 | 13 | 93.8% |
| Future | -25 | -29 | -29 | -33 | 51.1 | 145 | 30.3% |
| MAJOR Purchases | |||||||
| Current | -39 | -43 | -41 | -43 | 43.9 | 90 | 56.7% |
| Future | 3 | 1 | 3 | 3 | 95.7 | 3 | 98.6% |
| Total number of months: 208 | |||||||
by Tom Moeller June 24, 2009
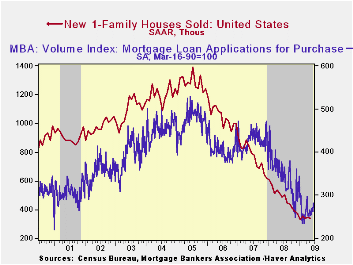 Sales
of new single-family homes during May continued the sideways movement
of 2009. Sales were stable with April at 342,000 units (AR) and have
shown little month-to-month change this year. That stability, however,
follows a one-third sales decline over the last year and a
three-quarters decline since the 2005 peak. May sales fell short of
Consensus expectations for sales of 360,000 units. The new home sales
figures are available in Haver's USECON database.
Sales
of new single-family homes during May continued the sideways movement
of 2009. Sales were stable with April at 342,000 units (AR) and have
shown little month-to-month change this year. That stability, however,
follows a one-third sales decline over the last year and a
three-quarters decline since the 2005 peak. May sales fell short of
Consensus expectations for sales of 360,000 units. The new home sales
figures are available in Haver's USECON database.
 Around the
country sales patterns continued to vary. Sales in the
Northeast and in the Midwest rose last month but sales barely inched
higher out West. Sales in the South reversed their April gain and fell
back to near the record low.
Around the
country sales patterns continued to vary. Sales in the
Northeast and in the Midwest rose last month but sales barely inched
higher out West. Sales in the South reversed their April gain and fell
back to near the record low.
The modest firming of home sales continued to strengthen prices. The median price for a new single-family home rose 4.2% last month to $221,600 after a like gain during April. Nevertheless, prices have fallen 3.5% over the last twelve months as well as since yearend 2008. Since their peak early in 2007, new home prices have fallen by roughly one-quarter.
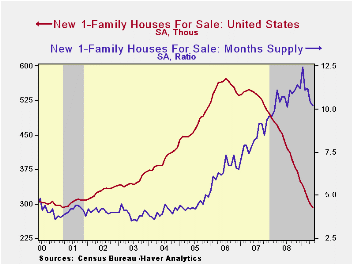
Price weakness has helped move the
inventory of unsold homes which has fallen by nearly one-half since the
peak during 2006. 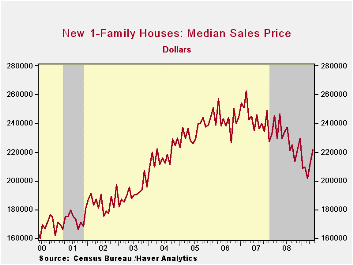 In each of the country's regions, inventories are
down by roughly one-third just during the last year. The
month's supply of new homes for sale also has started to drop. In May
the months supply in inventory fell to its lowest level since last
July. But there's more inventory to move with lower prices if sales
remain low.
In each of the country's regions, inventories are
down by roughly one-third just during the last year. The
month's supply of new homes for sale also has started to drop. In May
the months supply in inventory fell to its lowest level since last
July. But there's more inventory to move with lower prices if sales
remain low.
A related development indicated that mortgage applications for purchase of a home rose last week to the highest level since early April (-15.9% y/y). These figures from the Mortgage Bankers Association are available in Haver's SURVEYW database.
| US New Homes | May | April | Y/Y | 2008 | 2007 | 2006 |
|---|---|---|---|---|---|---|
| Total Sales (SAAR, 000s) | 342 | 344 | -32.8% | 479 | 768 | 1,049 |
| Northeast | 27 | 21 | -12.9 | 35 | 64 | 64 |
| Midwest | 51 | 43 | -32.0 | 69 | 118 | 161 |
| South | 184 | 201 | -35.9 | 264 | 408 | 559 |
| West | 80 | 79 | -31.0 | 111 | 178 | 266 |
| Median Price (NSA, $) | 221,600 | 212,600 | -3.4 | 230,408 | 243,742 | 243,067 |
by Tom Moeller June 24, 2009
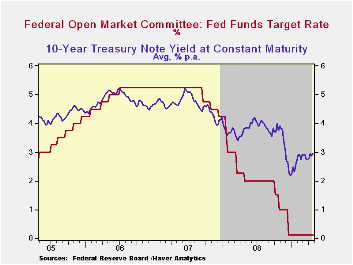
In an anticipated move, the Federal Open Market Committee today left the Federal funds rate in a "range from 0 to 1/4 percent." The discount also was left unchanged at 0.50%. The Fed funds rate remained the lowest ever. The decision was unanimous amongst FOMC voters.
The Fed indicated that "Information received since the Federal Open Market Committee met in April suggests that the pace of economic contraction is slowing. Conditions in financial markets have generally improved in recent months.
Much of the commentary on the economy was similar to the last meeting and concluded that "Although economic activity is likely to remain weak for a time, the Committee continues to anticipate that policy actions to stabilize financial markets and institutions, fiscal and monetary stimulus, and market forces will contribute to a gradual resumption of sustainable economic growth in a context of price stability."
Regarding inflation, the wording of the statement was slightly altered. The statement that "the Committee expects that inflation will remain subdued for some time" replaced the earlier statement that "the Committee sees some risk that inflation could persist for a time below rates that best foster economic growth and price stability in the longer term."
In its effort to promote economic liquidity, the Fed used the
same language as in April, "... to provide support to mortgage lending
and housing markets and to improve overall conditions in private credit
markets, the Federal Reserve will purchase a total of up to $1.25
trillion of agency mortgage-backed securities and up to $200 billion of
agency debt by the end of the year. In addition, the Federal Reserve
will buy up to $300 billion of Treasury securities by autumn."
For the complete text of the Fed's latest press release please follow this link.The Haver databases USECON, WEEKLY and DAILY contain the figures from the Federal Reserve Board.
Uncertainty About When the Fed Will Raise Interest Rates from the Federal Reserve Bank of St. Louis is available here.
| Current | Last | December | 2008 | 2007 | 2006 | |
|---|---|---|---|---|---|---|
| Federal Funds Rate, % (Target) | 0.00 - 0.25 | 0.00 - 0.25 | 0.16 | 1.93 | 5.02 | 4.96 |
| Discount Rate, % | 0.50 | 0.50 | 0.50 | 2.39 | 5.86 | 5.96 |

Tom Moeller
AuthorMore in Author Profile »Prior to joining Haver Analytics in 2000, Mr. Moeller worked as the Economist at Chancellor Capital Management from 1985 to 1999. There, he developed comprehensive economic forecasts and interpreted economic data for equity and fixed income portfolio managers. Also at Chancellor, Mr. Moeller worked as an equity analyst and was responsible for researching and rating companies in the economically sensitive automobile and housing industries for investment in Chancellor’s equity portfolio. Prior to joining Chancellor, Mr. Moeller was an Economist at Citibank from 1979 to 1984. He also analyzed pricing behavior in the metals industry for the Council on Wage and Price Stability in Washington, D.C. In 1999, Mr. Moeller received the award for most accurate forecast from the Forecasters' Club of New York. From 1990 to 1992 he was President of the New York Association for Business Economists. Mr. Moeller earned an M.B.A. in Finance from Fordham University, where he graduated in 1987. He holds a Bachelor of Arts in Economics from George Washington University.
More Economy in Brief


