 Global| Dec 21 2012
U.S. Durable Goods Orders Up 0.7% in November with Mixed Industry Pattern
Summary
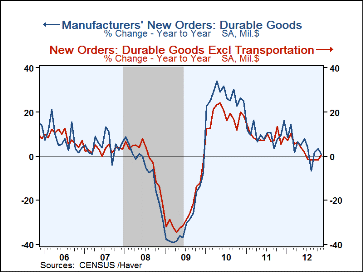
Durable goods orders increased 0.7% in November (0.8% y/y) after a 1.1% rise in October. October's figure was revised from the "advance" figure of zero change reported a month ago and the full manufacturing report number of 0.5%. [...]
Durable goods orders increased 0.7% in November (0.8% y/y) after a 1.1% rise in October. October's figure was revised from the "advance" figure of zero change reported a month ago and the full manufacturing report number of 0.5%. November's outcome was similar to the Consensus expectation of a 0.5% rise.
The transportation equipment sector was down 1.1% due to aircraft, for which orders remain volatile around a basically flat trend; the nondefense portion fell 13.9% in November and defense aircraft fell 12.3%. These declines were partially offset by a gain in motor vehicles and parts of 3.5%, limiting the decline in total transportation orders.
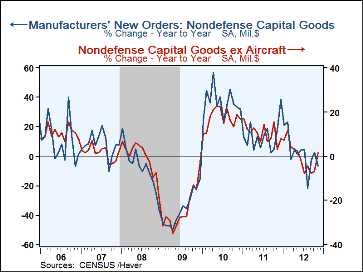
Durable goods orders excluding transportation were up 1.6% (0.4% y/y), a third consecutive steady increase that followed 1.9% in October and 1.7% in September. Several industries had good gains in November. Primary metals were up 2.4% for a second consecutive month, and fabricated metal products firmed to a 1.9% increase from 0.7% in October. Orders for nonelectrical machinery rose 3.3% following October's 3.4% rise, and electrical equipment and appliances followed their 5.6% October rise with another 1.8% in November. Other sectors were less vigorous, as computer and electronic products barely moved, just +0.1% after 2.2% in October, and all other durable goods industries reported a second successive erosion of 0.1%. Nondefense capital goods orders fell 2.8% in November, but this represented the combination of the fall in nondefense aircraft and a nice rise of 2.7% in all other nondefense capital goods orders.
Shipments of durable goods gained 1.5% (+6.0% y/y) and excluding transportation shipments were up 1.3% (+3.5% y/y). Unfilled orders edged up 0.1% (3.3% y/y) while inventories rose 0.2% (4.8% y/y).
The durable goods figures are available in Haver's USECON database. The Action Economics consensus forecast figure is in the AS1REPNA database.
| Durable Goods NAICS Classification | |||||||
|---|---|---|---|---|---|---|---|
| Nov | Oct | Sep | Y/Y | 2011 | 2010 | 2009 | |
| New Orders | 0.7 | 1.1 | 9.1 | 0.8 | 9.8 | 27.1 | -30.0 |
| Transportation | -1.1 | -0.6 | 29.7 | 1.6 | 12.8 | 57.4 | -42.0 |
| Total Excl Transportation | 1.6 | 1.9 | 1.7 | 0.4 | 8.6 | 18.0 | -25.4 |
| Nondefense Capital Goods | -2.8 | 2.8 | 22.8 | -6.6 | 13.2 | 36.3 | -36.9 |
| Excl Aircraft | 2.7 | 3.2 | -0.5 | 1.3 | 10.3 | 17.1 | -24.5 |
| Shipments | 1.5 | 0.1 | 0.5 | 6.0 | 9.6 | 11.4 | -21.0 |
| Inventories | 0.2 | 0.3 | 0.2 | 4.8 | 10.3 | 9.5 | -10.2 |
| Unfilled Orders | 0.1 | 0.3 | 0.1 | -3.3 | 10.3 | 9.6 | -19.5 |
Carol Stone, CBE
AuthorMore in Author Profile »Carol Stone, CBE came to Haver Analytics in 2003 following more than 35 years as a financial market economist at major Wall Street financial institutions, most especially Merrill Lynch and Nomura Securities. She had broad experience in analysis and forecasting of flow-of-funds accounts, the federal budget and Federal Reserve operations. At Nomura Securities, among other duties, she developed various indicator forecasting tools and edited a daily global publication produced in London and New York for readers in Tokyo. At Haver Analytics, Carol was a member of the Research Department, aiding database managers with research and documentation efforts, as well as posting commentary on select economic reports. In addition, she conducted Ways-of-the-World, a blog on economic issues for an Episcopal-Church-affiliated website, The Geranium Farm. During her career, Carol served as an officer of the Money Marketeers and the Downtown Economists Club. She had a PhD from NYU's Stern School of Business. She lived in Brooklyn, New York, and had a weekend home on Long Island.
More Economy in Brief
 Global| Feb 05 2026
Charts of the Week: Balanced Policy, Resilient Data and AI Narratives
by:Andrew Cates


