 Global| Sep 27 2006
U.S. Durable Goods Orders Unexpectedly Lost Steam
by:Tom Moeller
|in:Economy in Brief
Summary
New orders for durable goods fell 0.5% last month after a 2.7% decline during August which was deeper than initially reported. Consensus expectations had been for a 0.5% increase, though a weakening had been hinted by the lower ISM [...]
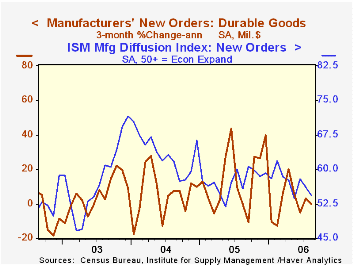
New orders for durable goods fell 0.5% last month after a 2.7% decline during August which was deeper than initially reported. Consensus expectations had been for a 0.5% increase, though a weakening had been hinted by the lower ISM index for new orders.
During the last ten years there has been a 69% correlation between the y/y change in durable goods orders and the change in output of durable goods.
Durable goods orders less the transportation sector fell 2.0% after no change during July. Orders for transportation equipment rose 3.7% (-0.8% y/y) after a 9.5% July decline and benefited from a 4.4% (-3.5% y/y) rise in motor vehicle & parts orders. That was offset by a 14.4% (-22.4% y/y) decline in aircraft & parts.
Orders for nondefense capital goods fell 3.5% and less aircraft ticked down 0.3%. Orders for machinery fell 2.1% (+9.9% y/y) while electrical equipment & appliance orders dropped 9.2% (-2.7% y/y). During the last ten years there has been an 86% correlation between the y/y change in capital goods orders less aircraft and the y/y change in business fixed investment in equipment & software from the GDP accounts.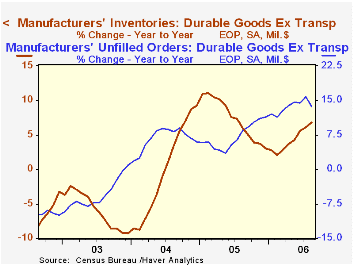
Orders for computers & electronic products reversed nearly all of the prior month's gain with a 4.7% (+3.2% y/y) drop. Computer orders fell 9.3% (-9.4% y/y) though orders for communications equipment recovered most of the July decline with a 7.0% (12.4% y/y) rise.
Shipments of durable goods jumped 1.9% (6.9% y/y) and less the transportation sector rose 0.5% (9.1% y/y). During the last ten years there has been an 82% correlation between the y/y change in durable goods shipments and the change in industrial production of durable goods.
Order backlogs inched up 0.4% (18.4% y/y) and less transportation rose just half (+13.7% y/y) that amount. Unfilled orders for nondefense aircraft & parts dipped 0.2% (+44.8% y/y).
Durable inventories rose 0.2% (6.2% y/y) after the 1.1% July spike. Less the transportation sector inventories rose 0.6% (6.8% y/y) after an upwardly revised 1.1% July pop. The inventory to shipments ratio outside of the transportation sector rose very slightly to its highest level since April.
The Productivity of Nations from the Federal Reserve Bank of Richmond can be found here.
| NAICS Classification | August | July | Y/Y | 2005 | 2004 | 2003 |
|---|---|---|---|---|---|---|
| Durable Goods Orders | -0.5% | -2.7% | 3.8% | 9.0% | 6.4% | -0.6% |
| Excluding Transportation | -2.0% | 0.0% | 5.8% | 9.4% | 7.6% | -1.7% |
| Nondefense Capital Goods | -3.5% | -0.6% | 0.7% | 21.4% | 5.6% | -3.4% |
| Excluding Aircraft | -0.3% | 0.9% | 7.2% | 12.3% | 2.8% | -2.0% |
by Tom Moeller September 27, 2006
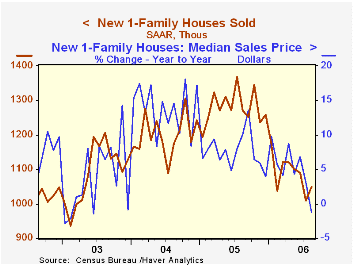
Sales of new single family home sales improved 4.1% last month to 1.05M, matched expectations and recovered more than half of July's decline. But that month's sales level was revised down to 1.009 from 1.072M estimated initially.
New home sales during the first eight months of this year are down 15.2% from the first eight months of 2005 and in August were 23.2% below the monthly peak during July 2005.
Sales rose last month across the country except in the West where they fell 17.7% (-34.7% y/y). Sales in the South rose 11.1% (-10.2% y/y) and in the Northeast sales jumped 21.7% (+5.0% y/y). In the Midwest sales rose 12.2% (-19.6% y/y.
The median sales price of a new single family home rose 0.3% to $237,000 and prior month's figures were revised up, but the year to year comparison turned negative (-1.3%) for the first time since December 2003.
The number of new homes for sale edged down 0.4% m/m in August but rose 19.1% y/y. The year to year breakdown by region is as follows: Northeast, 19.0%; West, 31.5%; South, 24.4%; Midwest, -1.0%.
Recent Trends in Homeownership from the Federal Reserve Bank of St. Louis can be found here.
| U.S. New Homes | August | July | Y/Y | 2005 | 2004 | 2003 |
|---|---|---|---|---|---|---|
| Total Sales (AR, 000's) | 1,050 | 1,009 | -17.4% | 1,280 | 1,201 | 1,091 |
| Median Price (NSA) | $237,000 | $236,200 | -1.3% | $234,208 | $217,817 | $191,383 |
by Tom Moeller September 27, 2006

The total number of mortgage applications fell 4.9% last week according to the Mortgage Bankers Association. For the month, applications nevertheless are 3.6% above the August average which fell 3.5% from July.
Purchase applications slid another 5.5% after the prior week's 3.0% decline. That dropped this month's gain to 2.7% versus a 3.5% decline during August. The latest level is 28.5% below the peak during May of 2005.
During the last ten years there has been a 58% correlation between the y/y change in purchase applications and the change in new plus existing single family home sales.
Applications to refinance slipped 4.1% after the prior week's 9.5% surge. The average level of refis in September is up 4.7% from August which surged 13.3% m/m from July.
The effective interest rate on a conventional 30-year mortgage fell a sharp 20 basis points to 6.39% and has averaged 6.51% this month versus 6.64% in August. The peak for 30 year financing was 7.08% late in June. The rate on 15-year financing also fell that amount w/w to 6.10% and the peak rate was 6.75%. Interest rates on 15 and 30 year mortgages are closely correlated (>90%) with the rate on 10 year Treasury securities.
During the last ten years there has been a (negative) 79% correlation between the level of applications for purchase and the effective interest rate on a 30-year mortgage.
Inflation Uncertainty and the Recent Low Level of the Long Bond Rate from the Federal Reserve Bank of Richmond is available here.
The Mortgage Bankers Association surveys between 20 to 35 of the top lenders in the U.S. housing industry to derive its refinance, purchase and market indexes. The weekly survey accounts for more than 40% of all applications processed each week by mortgage lenders. Visit the Mortgage Bankers Association site here.
| MBA Mortgage Applications (3/16/90=100) | 09/22/06 | 09/15/06 | Y/Y | 2005 | 2004 | 2003 |
|---|---|---|---|---|---|---|
| Total Market Index | 566.5 | 595.8 | -21.5% | 708.6 | 735.1 | 1,067.9 |
| Purchase | 375.9 | 397.9 | -22.2% | 470.9 | 454.5 | 395.1 |
| Refinancing | 1,677.5 | 1,748.7 | -20.4% | 2,092.3 | 2,366.8 | 4,981.8 |
by Carol Stone September 27, 2006

After a surge in credit card borrowing in 2004, British consumers slowed their use of credit cards last year and most recently, in six of the last eight months, they have cut their credit card debt absolutely. This pattern emerges from data reported today through August by the British Bankers Association for their MBBG group, the "Major British Banking Groups". In August, credit cards had net paydowns of £399 million, following £77 million in July and £260 million in June. This contrasts sharply with net increases that averaged £400 million in 2004.
Noncredit card debt activity remains greater. Consumers added £186 million in August, almost the same as June's advance of £189 million, with July at £368 million. Over the last year, these additions have averaged £321 million a month. At the same time, this is less than other recent years. In fact, it is the weakest 12-month experience since 1997. The peak usage of this form of consumer credit occurred during 2002, when 12-month averages ran right at £700 million in several months.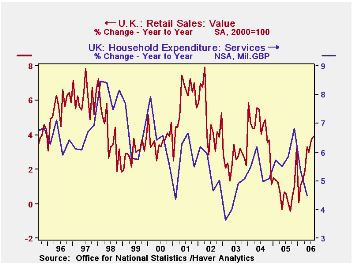
So consumers are reducing their reliance on credit. But retail sales data indicate that at least some forms of consumer spending are growing more vigorously, and these might be items consumers would buy on credit. Sales at clothing and household goods stores turned up in early 2005 and have accelerated since then. Outlays for services, as measured in the national accounts data, have slowed through Q2, though, and this may help explain the reduced use of consumer credit.
| UK: Net Changes, SA, mil.£* | Aug 2006 | July 2006 | June 2006 | Last 12 Months | Monthly Averages|||
|---|---|---|---|---|---|---|---|
| 2005 | 2004 | 2003 | |||||
| Credit Card Credit | -399 | -77 | -260 | -50 | +137 | +400 | +316 |
| Noncredit Card Credit | +186 | +368 | +189 | +321 | +395 | +552 | +461 |

Tom Moeller
AuthorMore in Author Profile »Prior to joining Haver Analytics in 2000, Mr. Moeller worked as the Economist at Chancellor Capital Management from 1985 to 1999. There, he developed comprehensive economic forecasts and interpreted economic data for equity and fixed income portfolio managers. Also at Chancellor, Mr. Moeller worked as an equity analyst and was responsible for researching and rating companies in the economically sensitive automobile and housing industries for investment in Chancellor’s equity portfolio. Prior to joining Chancellor, Mr. Moeller was an Economist at Citibank from 1979 to 1984. He also analyzed pricing behavior in the metals industry for the Council on Wage and Price Stability in Washington, D.C. In 1999, Mr. Moeller received the award for most accurate forecast from the Forecasters' Club of New York. From 1990 to 1992 he was President of the New York Association for Business Economists. Mr. Moeller earned an M.B.A. in Finance from Fordham University, where he graduated in 1987. He holds a Bachelor of Arts in Economics from George Washington University.
More Economy in Brief


