 Global| Feb 25 2010
U.S. Durable Goods Orders SurgeDue To Aircraft
by:Tom Moeller
|in:Economy in Brief
Summary
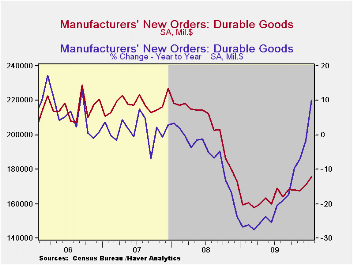
Improvement in the factory sector looked material last month. The overall level of durable goods orders jumped 3.0%, that followed an upwardly revised 1.9% December increase and it far outpaced Consensus expectations for a 1.5% gain. [...]
 Improvement
in the factory sector looked material last month. The overall level of
durable goods orders jumped 3.0%, that followed an upwardly revised
1.9% December increase and it far outpaced Consensus expectations for a
1.5% gain. Unfortunately, the strength was limited. Orders for
nondefense aircraft & parts more than doubled and mostly
recouped sharp declines during the prior two months.
Improvement
in the factory sector looked material last month. The overall level of
durable goods orders jumped 3.0%, that followed an upwardly revised
1.9% December increase and it far outpaced Consensus expectations for a
1.5% gain. Unfortunately, the strength was limited. Orders for
nondefense aircraft & parts more than doubled and mostly
recouped sharp declines during the prior two months.
Regardless of the January overstatement from the aircraft sector, the durable factory goods sector appeared on the mend after last year's recession. Less the transportation sector, orders slipped 0.6% though that followed two strong 2.0% monthly increases. That was enough to lift the y/y gain in orders to 8.6%. This strength suggests further improvement in shipments and industrial output are on the come after the modest y/y gains already logged.· Transportation sector orders last month were lifted by the jump in nondefense aircraft as well as by an 11.6% (66.4% y/y) rise in defense sector bookings. Orders for motor vehicles slipped m/m but were up modestly from last year. That increase followed annual declines during each of the last four years which left orders nearly half of their 2006 level
Improvement in other sectors continued last month. Primary metals orders increased 1.9% (31.6% y/y) following even stronger gains during each of the prior four months. Electrical equipment orders also rose 1.4% (3.8% y/y) while orders for computers & related equipment jumped 4.6% (16.0% y/y). Only machinery orders lagged with a 9.7% decline (+8.9% y/y) but that followed sharp increases during three of the prior four months.
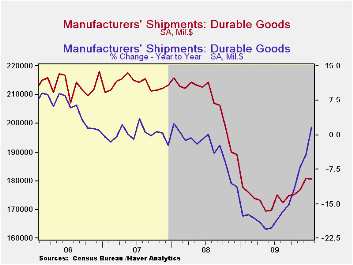
Shipments of durable goods slipped 0.2% (+1.7% y/y) during January following increases during the prior four months. The increase was led by an 8.5% jump (14.0% y/y) in shipments of computers & electronic products but that was offset by declines in shipments of nondefense capital goods (-3.2% y/y), machinery (-7.9% y/y) and electrical equipment (-2.2% y/y). Nevertheless, these negative y/y changes were much-reduced from those during the recession.
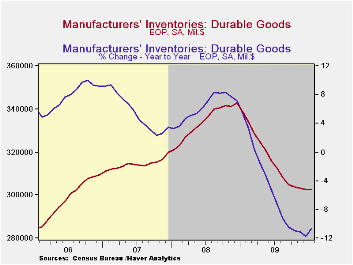
Perhaps the factory sector's inventory retrenchment is winding down, but it's not over. Durable goods inventories slipped just modestly during January (-10.6% y/y) as they did during the prior two months. However, these followed very sharp declines through September. Overall, since the December 2008 peak, inventories have fallen 11.7%.
The durable goods figures are
available in Haver's USECON database.
| NAICS Classification (%) | January | December | November | Y/Y | 2009 | 2008 | 2007 |
|---|---|---|---|---|---|---|---|
| Durable Goods Orders | 3.0 | 1.9 | -0.4 | 10.2 | -19.8 | -6.0 | 1.4 |
| Excluding Transportation | -0.6 | 2.0 | 2.0 | 8.6 | -17.3 | -1.4 | -0.3 |
| Nondefense Capital Goods | 4.7 | 2.5 | -3.0 | 15.9 | -23.9 | -7.0 | 3.6 |
| Excluding Aircraft | -2.9 | 3.3 | 3.2 | 10.7 | -18.2 | -0.5 | -2.7 |
by Tom Moeller February 25, 2010
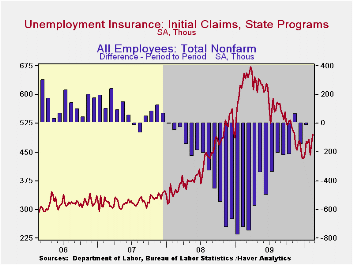 Snowstorms
in the eastern half and the southern regions of the country helped
prompt a jump in unemployment insurance claims. Today's Labor
Department report indicated that initial claims for jobless insurance
increased 22,000 last week to 496,000. The rise followed
strong weekly gains during both January and February which raised the
level to its highest since early-November. Nevertheless claims remained
down from the recession peak of 674,000 hit last March and claims
remained near the lowest level since January 2009. The weekly rise in
claims contrasted with Consensus expectations for a decline to 460,000.
The four-week moving average of initial claims rose to 473,750 and
remained just above the cycle low.
Snowstorms
in the eastern half and the southern regions of the country helped
prompt a jump in unemployment insurance claims. Today's Labor
Department report indicated that initial claims for jobless insurance
increased 22,000 last week to 496,000. The rise followed
strong weekly gains during both January and February which raised the
level to its highest since early-November. Nevertheless claims remained
down from the recession peak of 674,000 hit last March and claims
remained near the lowest level since January 2009. The weekly rise in
claims contrasted with Consensus expectations for a decline to 460,000.
The four-week moving average of initial claims rose to 473,750 and
remained just above the cycle low.
Continuing claims for unemployment insurance during the latest week rose slightly from the cycle-low and were down by one-third since late-June. Continuing claims were at the lowest level since early-January of last year. The overall decline is a function of the improved job market but also reflects the exhaustion of 26 weeks of unemployment benefits. Continuing claims provide an indication of workers' ability to find employment. The four-week average of continuing claims fell to a cycle low of 4,585,750. This series dates back to 1966.
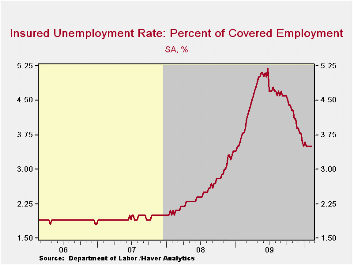
Extended benefits for unemployment insurance fell to another cycle low of 203,612. They were down by two-thirds from a peak of 597,688 reached in November. · The insured rate of unemployment remained stable for the fifth week at a low of 3.5%. The rate reached a high of 5.2% during late-June. During the last ten years, there has been a 93% correlation between the level of the insured unemployment rate and the overall rate of unemployment published by the Bureau of Labor Statistics.
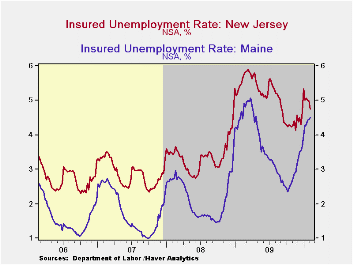
The highest insured unemployment rates in the week ending February 6 were in Alaska (7.5 percent), Oregon (6.5), Idaho (6.4), Montana (6.2), Wisconsin (6.2), Michigan (5.9), Puerto Rico (5.9), Nevada (5.8), Pennsylvania (5.7), and North Carolina (5.5). The lowest insured unemployment rates were in Virginia (2.3), Texas (2.5), Florida (3.4), Maryland (3.4), Mississippi (3.6), Wyoming (3.7), Ohio (3.9), Indiana (4.0), New York (4.1) and Maine (4.5). These data are not seasonally adjusted but the overall insured unemployment rate is.
The unemployment insurance claims data is available in Haver's WEEKLY database and the state data is in the REGIONW database.
| Unemployment Insurance (000s) | 2/20/10 | 2/13/10 | 2/6/10 | Y/Y | 2009 | 2008 | 2007 |
|---|---|---|---|---|---|---|---|
| Initial Claims | 496 | 474 | 442 | -24.4% | 573 | 419 | 321 |
| Continuing Claims | -- | 4,617 | 4,611 | -8.8% | 5,835 | 3,345 | 2,552 |
| Insured Unemployment Rate (%) | -- | 3.5 | 3.5 | 3.8 (2/2009) | 4.4 | 2.5 | 1.9 |
by Robert Brusca February 25, 2010
Manufacturing orders are up by 0.8% in December but the sequential growth rates do not show that the growth of orders continues to accelerate. MFG sales are also slowing as capital goods and intermediate goods sales rates over three-months are weaker than sales rates for six months
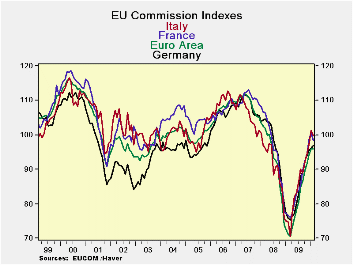
The overall EU index of confidence rose in February but the EMU index edged lower. Among the largest EU/EMU nations France and Italy saw declines. Germany posted a gain of 0.9% in the month while Spain‘s index advanced by 1.2%. The UK saw confidence edge up by a tiny 0.1%.
The overall EMU confidence measure stands in the 62nd percentile of its range but if we position it by queue among past values it stands in the bottom third among all confidence measures since 1989. Oddly the strongest relative standing of any sector is by retailing which is in the 64th percentile of its range and in the 57th percentile of its queue. The industrial sector and consumer confidence in their respective 50th to 55th range percentiles and in their respective 29th to 34th queue percentiles. The service sector stands just below its range mid point in its 49th percentile but sags back to a 23rd percentile standing in its queue
The difference between the range and queue percentiles tells us something about the density of the distribution of values for these readings. The queue percentile gives us a good fix on where the index stands compared to where it has been historically since a queue standing of 54% says that the indicator is weaker than this 54 percent of the time and stronger only 46 percent of the time.
The range standing simply positions the current reading between the best and worst readings in some historic span (since 1989). For now the range readings are higher than the queue readings because the current levels are elevated substantially from recession lows and the lows skew the range. But compared to the full spectrum of readings the current levels are not yet higher than they have been on average except for retailing (in the 57th percentile of its queue). So Europe is still lagging in its recovery. It is well short of getting back to neutral even though the recovery has slowed and this month has brought slippage to the EMU reading.
All the large countries continued to show overall sentiment readings that are below their queue midpoints, although four exceed their range midpoints. The highest queue standing is oddly and surprisingly in Italy with confidence in the 44th percentile of its queue followed by Germany, France and the UK all of which are in the 37th percentile of their respective queues. Spain is in the 16th percentile; EMU is in the 26th percentile.
So EMU is better than this nearly 75% of the time and this is after a 10 straight monthly rises in sentiment. That metric should stop you in your tracks. Even though the overall EMU reading stands in the 55th percentile between its worst and best readings, the ‘queue standing’ is just above the lower quartile. In addition to this Europe has big problems with Greece. You can see the dour mood in Spain with its 19% unemployment rate and then there is beleaguered Portugal. The ECB is on the cusp of new leadership – who will that be? Will it inspire stability? Will it be a tough inflexible guy like Weber from the Bundesbank or someone else? Europe is just a series of question marks. And if it backslides who does the US export to? The US has emerging troubles of its own
Welcome to 2010.
| EU Sectors and Country level Overall Sentiment | ||||||||||||
|---|---|---|---|---|---|---|---|---|---|---|---|---|
| EU | Feb 10 |
Jan 10 |
Dec 09 |
Nov 09 |
%tile | Rank | Max | Min | Range | Mean | By Queue Rank% |
Average Level |
| Overall Index | 97.4 | 97.2 | 95 | 91.5 | 62.4 | 166 | 115 | 68 | 47 | 100 | 33.9% | 100.5 |
| Industrial | -13 | -13 | -16 | -19 | 56.5 | 178 | 7 | -39 | 46 | -8 | 29.1% | -7.8 |
| Consumer Confid | -14 | -13 | -14 | -15 | 52.9 | 165 | 2 | -32 | 34 | -11 | 34.3% | -11.1 |
| Retail | -5 | -3 | -6 | -6 | 64.5 | 108 | 6 | -25 | 31 | -6 | 57.0% | -5.7 |
| Construction | -32 | -34 | -33 | -32 | 21.7 | 203 | 4 | -42 | 46 | -17 | 19.1% | -17.1 |
| Services | 0 | -2 | -2 | -9 | 49.2 | 123 | 32 | -31 | 63 | 13 | 23.1% | 12.8 |
| % m/m | Feb 10 |
Based on Level | Level | |||||||||
| EMU | -0.1% | 2.0% | 2.4% | 95.9 | 55.4 | 185 | 116 | 71 | 46 | 100 | 26.3% | 100.5 |
| Germany | 0.9% | 0.6% | 1.6% | 97.0 | 47.8 | 158 | 121 | 75 | 46 | 101 | 37.1% | 100.6 |
| France | -1.9% | 1.7% | 4.1% | 98.4 | 54.4 | 157 | 119 | 74 | 44 | 100 | 37.5% | 100.5 |
| Italy | -1.7% | 4.3% | 2.6% | 99.7 | 58.6 | 139 | 120 | 71 | 50 | 100 | 44.6% | 100.5 |
| Spain | 1.2% | 0.3% | 1.3% | 90.1 | 41.2 | 210 | 116 | 72 | 44 | 100 | 16.3% | 100.2 |
| Memo:UK | 0.1% | 3.4% | 6.9% | 98.3 | 66.1 | 158 | 115 | 65 | 50 | 100 | 37.1% | 100.2 |
| All since Feb 1989 | 251 | -Count | Services: | 160 | -Count | |||||||
| Sentiment is an index, sector readings are net balance diffusion measures | ||||||||||||

Tom Moeller
AuthorMore in Author Profile »Prior to joining Haver Analytics in 2000, Mr. Moeller worked as the Economist at Chancellor Capital Management from 1985 to 1999. There, he developed comprehensive economic forecasts and interpreted economic data for equity and fixed income portfolio managers. Also at Chancellor, Mr. Moeller worked as an equity analyst and was responsible for researching and rating companies in the economically sensitive automobile and housing industries for investment in Chancellor’s equity portfolio. Prior to joining Chancellor, Mr. Moeller was an Economist at Citibank from 1979 to 1984. He also analyzed pricing behavior in the metals industry for the Council on Wage and Price Stability in Washington, D.C. In 1999, Mr. Moeller received the award for most accurate forecast from the Forecasters' Club of New York. From 1990 to 1992 he was President of the New York Association for Business Economists. Mr. Moeller earned an M.B.A. in Finance from Fordham University, where he graduated in 1987. He holds a Bachelor of Arts in Economics from George Washington University.


