 Global| May 26 2010
U.S. Durable Goods Orders SoarWith Aircraft
by:Tom Moeller
|in:Economy in Brief
Summary
No category of factory orders can influence the Commerce Dept's monthly figures more than commercial aircraft. This has never been more evident than in recent months. During April, overall durable goods orders jumped 2.9%, while [...]
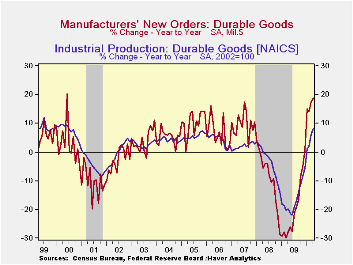
No category of factory orders can influence the Commerce Dept's monthly figures more than commercial aircraft. This has never been more evident than in recent months. During April, overall durable goods orders jumped 2.9%, while excluding the transportation sector altogether, orders fell 1.0%. That follows a roughly unchanged level of new durable orders during March and a 4.8% gain less transportation. Nevertheless, the trend improvement in the new orders total has been notable and part of the overall picture of factory sector improvement. A 1.5% gain in April durable goods orders was the Consensus expectation.
An 81.2% rise (91.5% y/y) in orders for aircraft & parts was behind the gain in transportation sector orders. Economic recovery and an aging fleet of planes caused orders for nondefense aircraft to more-than-triple m/m and they've also tripled during the last year. For the capital goods sector overall, April orders jumped 9.2% but less aircraft they fell 2.4%. Month-to-month volatility also was notable for primary metals orders which fell 2.0%. (They've risen 55.0% during the last year.) Machinery orders also fell a sharp 5.9% last month but they're up 24.2% y/y due to strength in four of the last five months. April orders for electrical equipment were weak and fell 6.9% (+13.4% y/y) while computer orders fell 3.0% but they're up by nearly one-half y/y.
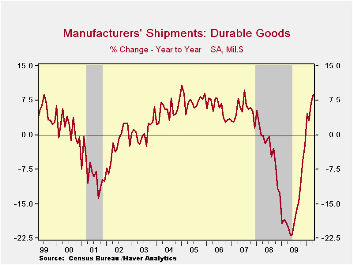
Shipments of durable goods followed the gains in orders and posted a 1.4% increase (8.8% y/y) after a 2.1% March rise. Shipments of computers led the gain with an 8.0% increase (27.8% y/y) along with a 1.9% increase (5.5% y/y) in shipments of electrical equipment. Machinery shipments fell 3.0% (+5.1% y/y) and primary metals shipments slipped 0.2% m/m (+46.1% y/y).
Accumulation of inventories is bolstering the increase in orders & shipments. Durable goods inventories rose 0.7% (-5.4% y/y) for the third month of firm increase. Nevertheless, inventories remained well below past levels. Since December 2009 inventories have risen 2.1% but levels remain lean after last year's 12.8% decline. Finally, backlogs of durable goods orders gained 0.4% last month but remained down 3.8% y/y.
The durable goods figures are available in Haver's USECON database. The latest durable goods data reflected earlier benchmark revisions.

| NAICS Classification (%) | April | March | February | Y/Y | 2009 | 2008 | 2007 |
|---|---|---|---|---|---|---|---|
| Durable Goods Orders | 2.9 | -0.0 | 0.5 | 18.9 | -20.7 | -9.0 | 9.7 |
| Excluding Transportation | -1.0 | 4.8 | 2.1 | 18.0 | -18.4 | -2.5 | 4.5 |
| Nondefense Capital Goods | 9.2 | -6.8 | 9.0 | 36.8 | -26.8 | -12.6 | 17.5 |
| Excluding Aircraft | -2.4 | 6.5 | 3.0 | 21.4 | -19.8 | -4.2 | 5.3 |
by Robert Brusca May 26, 2010
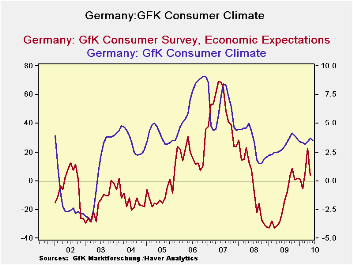
GFK’s confidence measure for Germany edged lower in June as the ongoing Greek situation took a small toll on German optimism. Gfk’s consumer confidence figure for June slipped to 3.5, a decrease on May's revised 3.7, marking the end of the index's short 2-month up-streak. According to the report, the key concern among German consumers is that Greek rescue packages and the weakening euro could hamper the German economy in its recovery.
The survey details recorded GFK’s fourth consecutive decline in the propensity to buy index, and reversed half of prior month's gains in the future salary expectations index. That index had recorded the highest value since 2001 just last month.
Despite consumer concerns, German companies have not been affected nor have they changed their business plans because of the possibility of government debt increases resulting from Germany's leadership of bailouts. Instead, German firms have actually benefited in export competitiveness from a declining Euro; the macroeconomic impact on the German budget has not been an issue.
Ironically the index and its supporting survey information suggests that the net impact of Germany’s participation in the bailout could be to get fiscally worried conservative German consumers to cutback more on spending that already is weak while German firms pursue a bonanza of opportunity abroad due to the euro’s weakening and their improved competitiveness.
| Germany Consumer Climate Survey GFK | ||||
|---|---|---|---|---|
| Climate | Expecations | Propensity to Buy | ||
| Economic | Income | |||
| Jun-10 | 3.5 | #N/A | #N/A | #N/A |
| May-10 | 3.7 | 3.9 | 23.7 | 18.1 |
| Apr-10 | 3.4 | 22.5 | 35.2 | 21.6 |
| Mar-10 | 3.2 | 4.5 | 13.5 | 23.4 |
| Feb-10 | 3.3 | -5.6 | 12.0 | 24.2 |
| Current | Lagged one month | |||
| Average | 3.6 | 1.4 | -2.8 | -4.8 |
| Max | 9.1 | 69.5 | 35.2 | 64.4 |
| Min | -3.5 | -32.9 | -24.5 | -55.4 |
| % range | 55.6% | 35.9% | 80.7% | 61.4% |
| Count% | 44.7% | 60.6% | 93.6% | 76.6% |
| % range is current reading as a percentile of Hi/Low range | ||||
| Count 0s current reading ranked as a %-tile among all readings | ||||
by Tom Moeller May 26, 2010
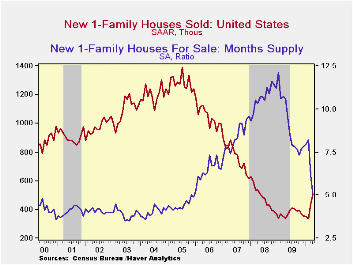
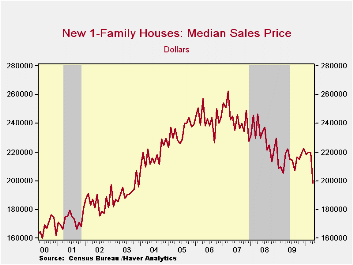
The April end to the Federal government's $8,000 home-buyer tax credit, like in March, caused new home sales to surge. New home sales jumped 14.8% m/m to 504,000 following the upwardly revised 29.9% advance during March. The latest level was the highest since May 2008. The latest sales level greatly exceeded Consensus expectations for 425,000 sales.
Price discounts likely helped sales during April. The median home price fell nearly 10% m/m for a 9.5% y/y decline. Firmer sales & lower prices have been quite successful in lowering the number of homes on the market to the lowest level in forty years.
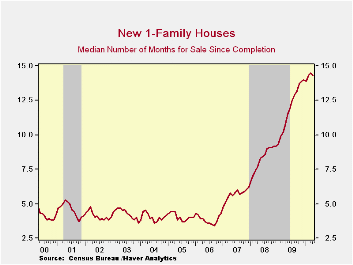
At the current sales rate, the months' supply of unsold homes dropped to 5.0 from its 2009 high of 12.1 months. However, despite all this improvement, it still took a near-record median 14.3 months to sell a new home in April.
Central Bank Independence, Transparency, and Accountability is today's speech by Fed Chairman Ben S. Bernanke and it can be found here.
| US New Homes | April | March | February | Y/Y | 2009 | 2008 | 2007 |
|---|---|---|---|---|---|---|---|
| Total Sales (SAAR, 000s) | 504 | 439 | 338 | 47.8% | 372 | 481 | 769 |
| Northeast | 39 | 39 | 31 | 85.7 | 31 | 35 | 64 |
| Midwest | 75 | 57 | 49 | 87.5 | 54 | 69 | 118 |
| South | 278 | 251 | 170 | 38.3 | 201 | 264 | 409 |
| West | 112 | 92 | 88 | 41.8 | 87 | 113 | 178 |
| Median Price (NSA, $) | $198,400 | $219,600 | $219,700 | -9.5 | 214,500 | 230,408 | 243,742 |
by Tom Moeller May 26, 2010
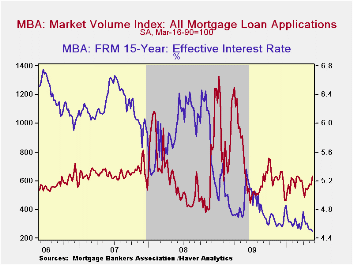
Lower interest rates are encouraging mortgage refinancings, but not so much new home purchases. The Mortgage Bankers Association reported that mortgage applications jumped last week and for May they've risen 11.5% from April. The May increase, however, just made up an April decline.
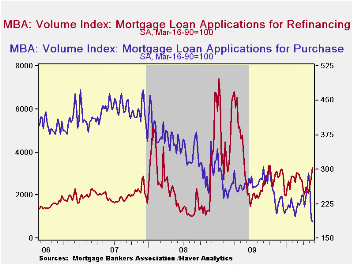
Mortgage refinancings jumped for the third consecutive week to the highest level since last October. Conversely, applications to purchase a home dropped sharply with the expiration of the Federal tax credit for home purchase. During the last ten years there has been a 51% correlation between the y/y change in purchase applications and the change in new plus existing single family home sales. The correlation has lessened recently.
The effective fixed interest rate on conventional 15-year mortgages averaged 4.50% during the latest week, the cycle low. For 30-year mortgages the rate also fell to an average 5.02%. Interest rates on fixed 15-year and 30-year mortgages are closely correlated (near-90%) with the rate on 10-year Treasury securities. Rates on adjustable one-year mortgages rose during the month to 6.93%, its highest since mid-2008.
| BA Mortgage Applications (SA, 3/16/90=100) | 05/21/10 | 05/14/10 | 05/07/10 | Y/Y | 2009 | 2008 | 2007 |
|---|---|---|---|---|---|---|---|
| Total Market Index | 633.5 | 569.2 | 578.1 | -19.4% | 736.4 | 642.9 | 652.6 |
| Purchase | 185.7 | 192.1 | 263.6 | -27.6 | 263.5 | 345.4 | 424.9 |
| Refinancing | 3,257.4 | 2,783.0 | 2,430.8 | -16.3 | 3,509.2 | 2,394.1 | 1,997.9 |
| 15-Year Mortgage Effective Interest Rate (%) | 4.50 | 4.53 | 4.52 | 4.82 (05/09) | 4.85 | 5.9 | 6.2 |

Tom Moeller
AuthorMore in Author Profile »Prior to joining Haver Analytics in 2000, Mr. Moeller worked as the Economist at Chancellor Capital Management from 1985 to 1999. There, he developed comprehensive economic forecasts and interpreted economic data for equity and fixed income portfolio managers. Also at Chancellor, Mr. Moeller worked as an equity analyst and was responsible for researching and rating companies in the economically sensitive automobile and housing industries for investment in Chancellor’s equity portfolio. Prior to joining Chancellor, Mr. Moeller was an Economist at Citibank from 1979 to 1984. He also analyzed pricing behavior in the metals industry for the Council on Wage and Price Stability in Washington, D.C. In 1999, Mr. Moeller received the award for most accurate forecast from the Forecasters' Club of New York. From 1990 to 1992 he was President of the New York Association for Business Economists. Mr. Moeller earned an M.B.A. in Finance from Fordham University, where he graduated in 1987. He holds a Bachelor of Arts in Economics from George Washington University.
More Economy in Brief


