 Global| Sep 25 2008
U.S. Durable Goods Orders Show Broad-based Decline Last Month
by:Tom Moeller
|in:Economy in Brief
Summary
New orders for durable goods fell 4.5% during August and that reversed all of the downwardly revised, modest increases during the prior two months. Last month's decline certainly reflected a 38.1% (+31.1% y/y) plunge in orders for [...]
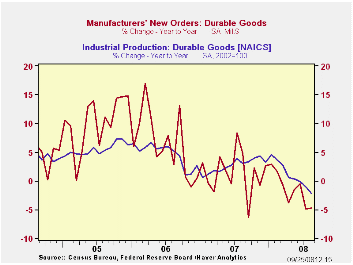
New orders for durable goods fell 4.5% during August and that reversed all of the downwardly revised, modest increases during the prior two months. Last month's decline certainly reflected a 38.1% (+31.1% y/y) plunge in orders for commercial aircraft, but elsewhere orders also fell sharply. Consensus expectations had been for a 1.5% decline in orders last month.
Less the transportation sector altogether, durable goods orders fell 3.0% after a downwardly revised 0.1% July uptick. Expectations had been for a dip during August. On a three-month basis growth in orders less the transportation sector fell to -1.5% (AR), the weakest since late last year.
August orders for nondefense capital goods fell 7.5% paced by the plunge in orders for commercial aircraft. Nevertheless, without aircraft nondefense capital goods orders dropped 2.0%. That lowered the three-month growth rate to -0.2%, it's worst since early last year. During the last ten years there has been an 80% correlation between the y/y gain in nondefense capital goods orders and the rise in equipment & software spending in the GDP accounts. The correlation of the GDP figure with capital goods shipments is, as one would expect, a larger 92%.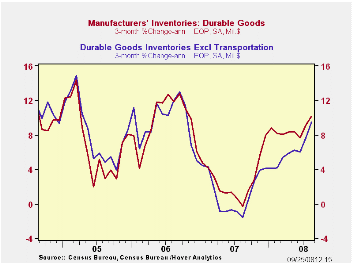
Outside the transportation sector, new orders were weak led by a 6.2% plunge in new orders for machinery. These orders still were up 5.2% y/y but three-month growth fell to -0.9%.Primary metals orders also turned weak as they posted a 9.3% (+12.0% y/y) drop which reversed virtually all of the gains during the prior two months. New orders for electrical equipment also fell a sharp 2.2% -1.2% y/y) after the downwardly revised 8.2% July shortfall. On a three-month basis these orders were down at a 20.8% annual rate.
The 1.9% August rise in new orders for computers & electronic products belies the weakness that has developed in this sector. On a three-month basis these orders fell at a 6.7% rate after a 2.1% decline during all of last year. Orders for just computers & related products increased 2.0% (-14.8% y/y) after a downwardly revised 13.2% July plunge. New orders for communications equipment were stronger and they posted a 4.6% (1.3% y/y) increase. Three-month growth amounted to 5.5%, a recovery from last year's 7.5% decline.
Overall shipments of durable goods fell 3.5% (-2.6% y/y) and that reversed a 2.3% July increase. During the last three months growth is a negative 1.7% (AR) after last year's negligible 0.1% uptick. For comparison, industrial production of durable goods during the last three months is -3.0% (-2.2% y/y). During the last ten years there has been a 79% correlation between the y/y change in shipments of durable goods and the change in durables industrial production. Less transportation, shipments of durable goods reversed all of their July increase and fell 2.1% (+2.1% y/y). Three-month growth was 2.2% (AR), down from 5.9% in January.
Inventories of durable goods again were strong and they rose 0.7% (8.1% y/y). Three-month growth amounted to 10.2% (AR), the strongest rate of accumulation in roughly two years. Less transportation, inventories also rose a strong 0.7% (5.9% y/y) and the three-month growth rate amounted to 5.9% after the 1.4% rise during 2007.
| NAICS Classification | August | July | Y/Y | 2007 | 2006 | 2005 |
|---|---|---|---|---|---|---|
| Durable Goods Orders | -4.5% | 0.8% | -4.7 % | 1.4% | 6.2% | 10.2% |
| Excluding Transportation | -3.0 | 0.1 | 1.4 | -0.3 | 9.1 | 9.1 |
| Nondefense Capital Goods | -7.5 | 3.5 | -1.9 | 3.5 | 9.4 | 17.3 |
| Excluding Aircraft | -2.0 | 0.4 | 1.9 | -2.7 | 10.7 | 11.6 |
by Tom Moeller September 25, 2008
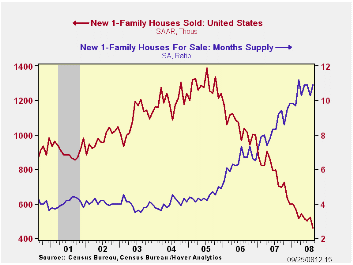
August sales of new single-family homes dropped 11.5% from July following a little revised 4.0% increase during that month. The latest drop greatly exceeded Consensus expectations. More impressive, however, was that the latest level of sales was the lowest since January of 1991 and it undoubtedly reflected the recent turmoil in the credit markets.
By region, sales in the West fell by one-third from their July level and that pulled sales down 50.0% from the year ago total. From their peak level in 2005, sales out West are down 82.1%. New home sales in the Northeast also were notably weak and they posted a 31.9% m/m decline. The level about equaled where sales were in May but that was down 69.2% from the 2004 peak. New home sales in the South fell a lesser 2.1% m/m but they were still down 60.4% from the early-2005 high. In the Midwest sales recovered 7.2% m/m following three months of sharp decline. However, the latest level still was down 71.1% from the 2003 peak.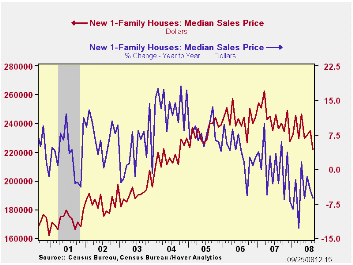
The median price for a new single-family home fell 5.5% m/m to $221,900. The 6.2% y/y decline compares to a peak rate of growth of 13.9% back in 2004.
The number of new homes for sale fell further, by a sharp 4.4% (-23.5% y/y). That reduced the inventory of unsold homes to the lowest level since late-2004. In each of the country's regions the inventory is down just short of one-quarter during the last year.
The month's supply of new homes for sale ticked slightly higher to 10.9 and that was near the record high.
Fed Chairman Ben S. Bernanke's testimony the morning on the Economic Outlook can be found here.
| US New Homes | August | July | Y/Y | 2007 | 2006 | 2005 |
|---|---|---|---|---|---|---|
| Total Sales (SAAR, 000s) | 460 | 520 | -34.5% | 768 | 1,049 | 1,279 |
| Northeast | 32 | 47 | -45.8 | 64 | 64 | 81 |
| Midwest | 74 | 69 | -39.3 | 118 | 161 | 203 |
| South | 276 | 282 | -24.4 | 408 | 559 | 638 |
| West | 78 | 122 | -50.0 | 178 | 266 | 356 |
| Median Price (NSA, $) | 221,900 | 234,900 | -6.2 | 243,742 | 243,067 | 234,208 |
by Tom Moeller September 25, 2008
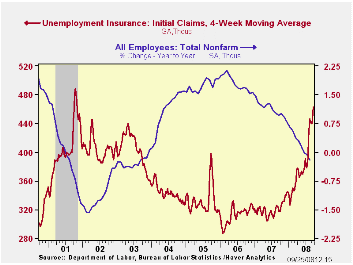
Initial claims for unemployment insurance jumped again last week. The level of 493,000 compared to an upwardly revised 461,000 during the week prior. The latest was the highest level since during the recession of 2001.
The four-week moving average also jumped to the highest level since the last recession and stood at 462,500 (45.7% y/y). During August initial claims averaged 443,000.
A claims level below 400,000 typically has been associated with positive growth in nonfarm payrolls. During the last ten years there has been a (negative) 76% correlation between the level of initial claims and the m/m change in nonfarm payroll employment. Over the longer period of time, the level of claims for jobless insurance has not trended higher with the size of the labor force due to a higher proportion of self-employed workers who are not eligible for benefits.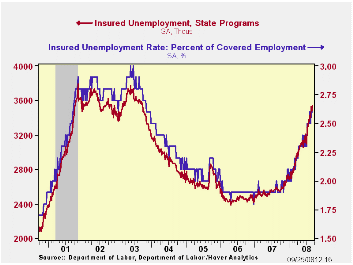
Continuing claims for unemployment insurance during the latest week rose 63,000 and reversed a 53,000 decline during the prior period. The four-week average of claims rose to 3,489,250. That was the highest level since July 2003. Continuing claims provide some indication of workers' ability to find employment and they lag the initial claims figures by one week.
The insured rate of unemployment held stable for the third week at 2.6%, the highest level since late-2003.
| Unemployment Insurance (000s) | 09/20/08 | 09/13/08 | Y/Y | 2007 | 2006 | 2005 |
|---|---|---|---|---|---|---|
| Initial Claims | 493 | 461 | 59.5% | 322 | 313 | 331 |
| Continuing Claims | -- | 3,542 | 38.4% | 2,552 | 2,459 | 2,662 |
by Robert Brusca September 25, 2008
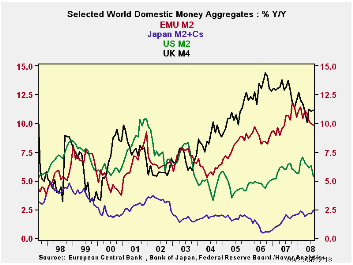
UK money supply is decelerating at the most rapid pace among our sample countries but its growth rate for real balances is still strong: 6.1% over 12 months and 11% (saar) over 3 months. Over the past year real EMU growth money is just about as strong as in the UK. The US shows substantial money supply deceleration and posts negative growth rates in real balances for horizons inside one year. The same is true of Japan.
In Europe credit to residents and overall loan growth are still strong and have hardly slowed. The slowing in real balances is more a function of rising inflation than of slowing credit.
While the credit crunch in the US has been more severe Europeans have created money at a much more rapid pace despite their insistence on a cap for overall money growth. Both the UK and the ECB have made a laughing stock of that ceiling rate.
Take my cap for money supply growth—Please! It’s like an old worn vaudeville joke.
In some quarters there are still concerns about accounting losses at European banks. US institutions are being hit harder and the impact is showing up in the money markets where trading has been seized up at various points. Growth is slowing everywhere and in Europe the news about slowing has been coming fast and furious. For the US the long standing bad news is getting a bit worse. Despite appearances European growth will slow a lot more and the ECB will be in dilemma over what to do with inflation and money growth still so high. It is interesting to note that the US central bank cut rates more aggressively yet has kept money supply growth in check much better than has Europe.
| Look at Global and Euro Liquidity Trends< | |||||||
|---|---|---|---|---|---|---|---|
| Saar-all | Euro Measures (EA15): Money & Credit | G-10 Major Markets: Money | Memo | ||||
| €€-Supply M2 | Credit:Resid | Loans | $US M2 | ££UK M4 | ¥¥Jpn M2+Cds | OIL:WTI | |
| 3-MO | 7.4% | 9.0% | 6.0% | 1.5% | 17.8% | 2.9% | -23.5% |
| 6-MO | 8.3% | 9.1% | 7.4% | 3.5% | 12.5% | 1.8% | 52.4% |
| 12-MO | 9.8% | 11.1% | 8.9% | 5.4% | 11.2% | 2.4% | 61.3% |
| 2Yr | 10.3% | 11.2% | 9.9% | 5.9% | 12.4% | 2.1% | 26.5% |
| 3Yr | 9.6% | 11.4% | 10.3% | 5.5% | 12.8% | 1.6% | 21.7% |
| Real Balances: deflated by Own CPI. Oil deflated by US CPI | |||||||
| 3-MO | 5.1% | 6.6% | 3.7% | -5.3% | 11.0% | -1.5% | -28.6% |
| 6-MO | 4.9% | 5.7% | 4.1% | -2.4% | 6.7% | -1.4% | 43.7% |
| 12-MO | 5.8% | 7.0% | 4.8% | 0.0% | 6.1% | 0.2% | 53.1% |
| 2Yr | 7.3% | 8.2% | 6.9% | 2.2% | 8.9% | 1.1% | 22.1% |
| 3Yr | 6.8% | 8.6% | 7.5% | 1.7% | 9.5% | 0.6% | 17.3% |

Tom Moeller
AuthorMore in Author Profile »Prior to joining Haver Analytics in 2000, Mr. Moeller worked as the Economist at Chancellor Capital Management from 1985 to 1999. There, he developed comprehensive economic forecasts and interpreted economic data for equity and fixed income portfolio managers. Also at Chancellor, Mr. Moeller worked as an equity analyst and was responsible for researching and rating companies in the economically sensitive automobile and housing industries for investment in Chancellor’s equity portfolio. Prior to joining Chancellor, Mr. Moeller was an Economist at Citibank from 1979 to 1984. He also analyzed pricing behavior in the metals industry for the Council on Wage and Price Stability in Washington, D.C. In 1999, Mr. Moeller received the award for most accurate forecast from the Forecasters' Club of New York. From 1990 to 1992 he was President of the New York Association for Business Economists. Mr. Moeller earned an M.B.A. in Finance from Fordham University, where he graduated in 1987. He holds a Bachelor of Arts in Economics from George Washington University.
More Economy in Brief


