 Global| Apr 26 2006
U.S. Durable Goods Orders' Rise = Factory Sector Resilience
by:Tom Moeller
|in:Economy in Brief
Summary
New orders for durable goods jumped 6.1% last month and the 3.4% February increase was upwardly revised. The jump pulled the y/y increase in orders to 17.7%, its strongest in six years, and the m/m gain by far outpaced Consensus [...]

New orders for durable goods jumped 6.1% last month and the 3.4% February increase was upwardly revised. The jump pulled the y/y increase in orders to 17.7%, its strongest in six years, and the m/m gain by far outpaced Consensus expectations for a 1.8% rise. Moreover, the details of the report were constructive for factory sector activity.
During the last ten years there has been a 69% correlation between the y/y change in durable goods orders and the change in output of durable goods.
Higher orders for nondefense aircraft & parts led last month's strength with a 71.1% (329.3% y/y) spike that followed the 59.9% February spurt. And new orders for motor vehicles & parts reversed the prior month's decline with a 2.8% (4.2% y/y) rise.
Less the transportation sector altogether, durable goods orders rose 2.8% which more than made up for a little revised 1.1% decline during February.
Orders for computers & electronic products were notably strong last month and posted a 7.5% (7.4% y/y) gain while machinery orders recouped about all of the prior month's decline with a 7.5% (16.3% y/y) increase. Also strong were orders for fabricated metals which increased 1.3% (7.1% y/y) and orders for primary metals rose 1.1% (8.5% y/y). Electrical equipment orders were the laggard last month and fell 1.8% (+13.2% y/y) after a 4.1% February drop.
Orders for nondefense capital goods jumped 12.1% with higher Boeing orders but orders less aircraft still increased 3.0% after a 0.8% February decline that was shallower than initially reported.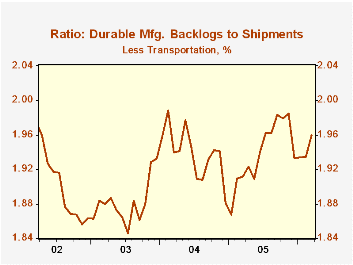
During the last ten years there has been an 87% correlation between the y/y change in capital goods orders less aircraft and the y/y change in business fixed investment in equipment & software from the GDP accounts.
Shipments of durable goods increased 0.3% (7.6% y/y) following a 0.4% February rise and less the transportation sector shipments were unchanged (8.1% y/y) following a 0.4% February increase. During the last ten years there has been an 82% correlation between the y/y change in durable goods shipments and the change in industrial production of durable goods.
Order backlogs surged 2.8% (20.9% y/y), a jump dominated by the strength in unfilled orders for aircraft & parts which rose 6.6% (70.6% y/y). Less transportation backlogs also were strong and rose 1.3% (10.8% y/y) lifting the ratio of backlogs to shipments outside of transportation to the highest level since November.
Durable inventories rose 0.7% (3.0% y/y) after a 0.4% February decline. Less transportation inventories rose an identical 0.7% (3.4% y/y) while the inventory to sales ratio outside of the transportation sector rose to the highest level since November.
| NAICS Classification | Mar | Feb | Y/Y | 2005 | 2004 | 2003 |
|---|---|---|---|---|---|---|
| Durable Goods Orders | 6.1% | 3.4% | 17.7% | 8.6% | 9.5% | 4.1% |
| Excluding Transportation | 2.8% | -1.1% | 9.6% | 8.6% | 11.7% | 3.1% |
| Nondefense Capital Goods | 12.1% | 4.0% | 31.5% | 20.0% | 11.0% | 4.2% |
| Excluding Aircraft | 3.0% | -0.8% | 11.8% | 10.7% | 9.5% | 4.8% |
by Tom Moeller April 26, 2006
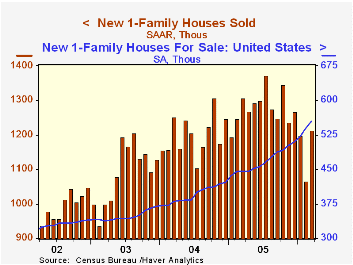
Last month new home sales showed surprising resilience with a 13.8% jump to 1.21 million (SAAR), the highest level this year. The jump contrasted to Consensus expectations for a more moderate increase to 1.115M and a 10.9% drop during February was little revised.
Despite last month's increase in sales, the latest level was 11.5% below last July's peak and sales during the first quarter were 9.4% below the 2005 average.
On the up trend has been the number of homes up for sale. That figure rose 2.8% last month and it's up by nearly one quarter during the last twelve months. Most pronounced is the 60.6% y/y gain in homes for sale in the Northeast.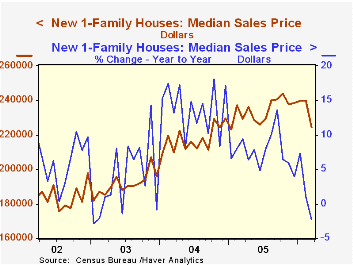
Gains in March sales throughout the nation were robust but most pronounced was a 35.7% (-13.1% y/y) jump out West which recovered about all of the prior month's plunge. Sales in the Midwest also were strong and rose 10.9% (-8.9% y/y) while sales in the Northeast rose 4.7% (-15.2% y/y). The 6.9% gain in sales down South (-2.3% y/y) recovered nearly all of the declines during the prior two months.
Prices were under pressure as suggested by a 6.5% (-2.2% y/y decline in the median sales price. The average sales price fell 7.1% (-3.6% y/y) suggesting either more price discounting of large homes or greater sales declines of large homes.
| U.S. New Homes | Mar | Feb | Y/Y | 2005 | 2004 | 2003 |
|---|---|---|---|---|---|---|
| Total Sales (AR, 000's) | 1,213 | 1,066 | -7.2% | 1,279 | 1,200 | 1,091 |
| Median Price (NSA) | $224,200 | $239,900 | -2.2% | $234,208 | $217,817 | $191,383 |
by Tom Moeller April 26, 2006
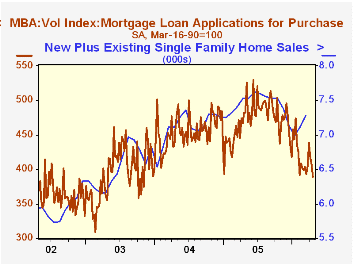
The total number of mortgage applications dropped 3.7% last week, down hard for the third consecutive period. In April applications are 2.4% below the March average which fell 1.0% from February.
Purchase applications fell another 4.4% w/w and that pulled the April average 0.7% below March which rose 0.2% versus February.
During the last ten years there has been a 54% correlation between the y/y change in purchase applications and the change in new plus existing single family home sales.
Applications to refinance dropped 2.4% and in April are 4.9% below the March average.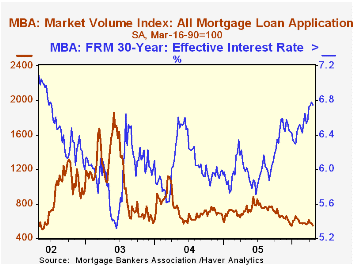
The effective interest rate on a conventional 30-year mortgage eased slightly to 6.75% from 6.78% the prior week while the rate on 15-year financing slipped to 6.45%. Interest rates on 15 and 30 year mortgages are closely correlated (>90%) with the rate on 10 year Treasury securities and during the last ten years there has been a (negative) 82% correlation between purchase applications and the effective rate on a 30-Year mortgage.
The Mortgage Bankers Association surveys between 20 to 35 of the top lenders in the U.S. housing industry to derive its refinance, purchase and market indexes. The weekly survey accounts for more than 40% of all applications processed each week by mortgage lenders. Visit the Mortgage Bankers Association site here.
| MBA Mortgage Applications (3/16/90=100) | 04/21/06 | 04/14/06 | Y/Y | 2005 | 2004 | 2003 |
|---|---|---|---|---|---|---|
| Total Market Index | 548.6 | 569.6 | -23.0% | 708.6 | 735.1 | 1,067.9 |
| Purchase | 389.4 | 407.4 | -19.2% | 470.9 | 454.5 | 395.1 |
| Refinancing | 1,489.4 | 1,526.1 | -27.4% | 2,092.3 | 2,366.8 | 4,981.8 |
by Carol Stone April 26, 2006
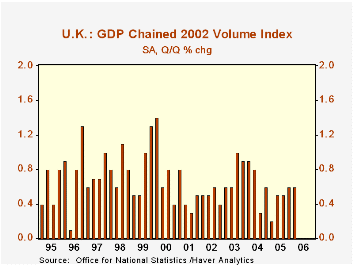
In the UK, the first major economy to report for Q1, growth maintained a 0.6% quarterly rate, the same as in Q4. However, growth was much more evenly balanced among various sectors, so the gain can be viewed more favorably because it is more broadly based.
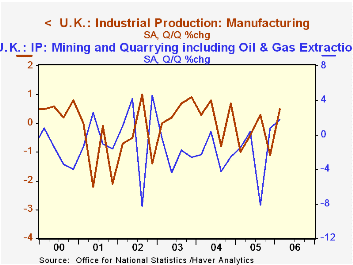
Production industries, in particular, turned up after four consecutive quarterly declines, and at 0.7% growth, had their best performance since Q3 1999. All three major sectors, mining (including oil and gas extraction), manufacturing and utilities, participated.
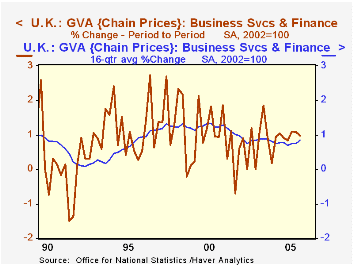
Service industries, in contrast, slowed from their pace in the second half of last year, although their 0.6% growth remained in a range that has characterized the last several years. In Q1, the distribution, lodging and catering industries were flat following a sizable increase in Q4. Transportation and communications increased 0.9% after Q4's 1.5%; this sector has been somewhat less volatile in recent quarters than the saw-tooth pattern it has generally traced over the past 20 years. The business services and finance sector has been smoothing even more. It grew almost exactly 1.0% in Q1, equal to its six-quarter average increase. So while the latest gain isn't the largest ever, it is far more likely to be sustained than the pointed ups and downs of the years before 2004.
So the UK experienced growth this past quarter that is steadier and broader than before. This combination, like diversity in an investment portfolio, puts that economy in a better position to withstand adverse developments in the months ahead, such as still higher energy prices or other inflationary stresses.
| United Kingdom: (Chained, SA, 2002=100) |
Q1 2006 | Q4 2005 | Q3 2005 | Year/ Year | 2005 | 2004 | 2003 |
|---|---|---|---|---|---|---|---|
| GDP* | 0.6 | 0.6 | 0.5 | 2.2 | 1.8 | 3.1 | 2.5 |
| Production Industries | 0.7 | -0.9 | -0.7 | -1.0 | -1.9 | 0.6 | -0.5 |
| Service Industries | 0.6 | 1.0 | 0.8 | 3.0 | 2.8 | 3.5 | 2.7 |

Tom Moeller
AuthorMore in Author Profile »Prior to joining Haver Analytics in 2000, Mr. Moeller worked as the Economist at Chancellor Capital Management from 1985 to 1999. There, he developed comprehensive economic forecasts and interpreted economic data for equity and fixed income portfolio managers. Also at Chancellor, Mr. Moeller worked as an equity analyst and was responsible for researching and rating companies in the economically sensitive automobile and housing industries for investment in Chancellor’s equity portfolio. Prior to joining Chancellor, Mr. Moeller was an Economist at Citibank from 1979 to 1984. He also analyzed pricing behavior in the metals industry for the Council on Wage and Price Stability in Washington, D.C. In 1999, Mr. Moeller received the award for most accurate forecast from the Forecasters' Club of New York. From 1990 to 1992 he was President of the New York Association for Business Economists. Mr. Moeller earned an M.B.A. in Finance from Fordham University, where he graduated in 1987. He holds a Bachelor of Arts in Economics from George Washington University.


