Global| Oct 28 2009
U.S. Durable Goods Orders Rise,Continuing Firm Uptrend
by:Tom Moeller
|in:Economy in Brief
Summary
The manufacturing sector's recovery appears intact. Durable goods orders recovered an expected 1.0% last month following declines during two of the prior three months. Moreover, the three-month rate of increase held at a firm 12.6% [...]
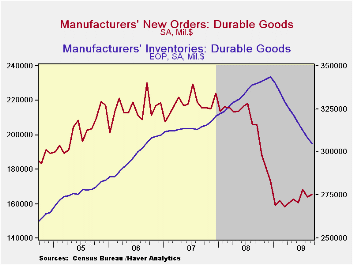
The manufacturing sector's recovery appears intact. Durable goods orders recovered an expected 1.0% last month following declines during two of the prior three months. Moreover, the three-month rate of increase held at a firm 12.6% (AR). That increase followed a 51% rate of decline through last December. Since January orders have risen 4.1%.
Transportation equipment orders rose 1.1% last month, held
back by a 0.1% (-24.1% y/y) downtick in motor vehicle & parts
orders and a 2.1% (-51.3% y/y) decline in nondefense aircraft orders.
Excluding the volatile transportation equipment sector orders show
clear improvement. With a 0.9% rise last month, orders have risen 3.3%
from their January low and have increased at a 5.9% rate during the
last three months.
Higher orders for primary metals have led the improvement in durables bookings. The 0.3% increase last month followed strong gains during the prior three months and the three-month rate of increase rose to 24.5%. Orders for fabricated metals also have been quite strong. Following this strength is the electrical equipment sector. Though orders fell during the last two months, the three-month rate of increase held at a firm 6.5%. Also showing improvement has been orders for computers & related equipment. The weak 0.4% rise last month failed to make up large declines during the prior two months, but since their April low, orders have risen 9.6%.
The capital goods sector also has improved. New orders for nondefense capital goods rose 2.5% and they rose 2.0% excluding aircraft & parts. These latest increases build on strength developed this summer and orders have risen 8.1% from the April low.
Shipments of durable goods are now reflecting the improvement
in orders. With a 0.8% rise last month, the three-month rate of
increase improved to 6.6% and shipments are now 2.4% higher than the
May low. The improvement has been paced by gains in shipments of metals
but the machinery and electrical equipment sectors continue to lag.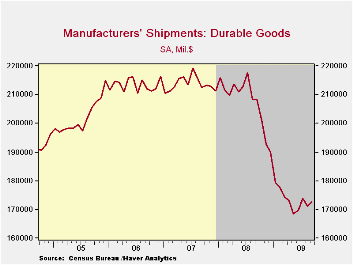
Inventories of durable manufactured goods continued lower and posted a 1.0% decline which was the ninth consecutive monthly drop totaling 11.2%. The shedding of inventory has been broad-based led by a 21.0% decline this year in the metals area, a 20.5% drop in computer inventories, a 16.2% drop in motor vehicles and an 11.9% in electrical equipment.
The durable goods figures are available in Haver's USECON database.
| NAICS Classification (%) | September | August | July | Y/Y | 2008 | 2007 | 2006 |
|---|---|---|---|---|---|---|---|
| Durable Goods Orders | 1.0 | -2.6 | 4.8 | -19.6 | -5.8 | 1.4 | 6.2 |
| Excluding Transportation | 0.9 | -0.4 | 0.9 | -16.9 | -1.2 | -0.3 | 9.1 |
| Nondefense Capital Goods | 2.5 | -7.7 | 7.0 | -21.0 | -6.8 | 3.5 | 9.4 |
| Excluding Aircraft | 2.0 | -0.8 | -1.3 | -16.6 | -0.3 | -2.7 | 10.7 |
by Robert Brusca October 28, 2009
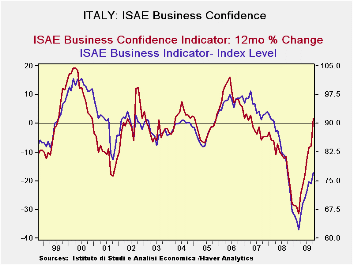
Last month Italian consumers felt great and Italian businesses
felt worse. In October, Italian consumers felt decidedly worse while
business sentiment advanced nicely to a 13 month high.
Still the overall biz indicator stands only in the 37th
percentile of its long term range that is well below the mid point and
not near enough to a normal, let alone recovery, reading yet. Orders
score a -51 raw reading a figure that stand in the bottom 20th
percentile of its range. Domestic orders are relatively better off than
foreign orders as domestic orders stand in their 25th range percentile
while foreign orders stand in their 17th percentile.
In Italy investment goods stand in lower range percentiles than do consumer goods. Italy’s revival seems to be more on the back of the consumer that Germany’s which seems to be relatively more on the aback of foreign demand. Since the consumer is lagging and troubled that is something to keep a close eye on. Foreign orders to Italian exporters have been showing signs of weakening. For that to happen as Italian domestic demand form consumers fades is an ominous sign.
| Italy ISAE Business Sentiment | ||||||
|---|---|---|---|---|---|---|
| Since Oct 1996 | ||||||
| Oct-09 | Sep-09 | Aug-09 | Jul-09 | Percentile | Rank | |
| Biz Confidence | 77.1 | 74.3 | 74.7 | 72.5 | 37.7 | 136 |
| TOTAL INDUSTRY | ||||||
| Order books & Demand | ||||||
| Total | -51 | -52 | -51 | -58 | 20.0 | 138 |
| Domestic | -49 | -49 | -48 | -53 | 25.9 | 139 |
| Foreign | -55 | -56 | -51 | -61 | 17.5 | 140 |
| Inventories | -2 | 1 | 2 | 1 | 37.5 | 122 |
| Production | -49 | -47 | -47 | -52 | 15.5 | 141 |
| INTERMEDIATE | ||||||
| Order books & Demand | ||||||
| Total | -57 | -55 | -54 | -60 | 21.6 | 140 |
| Domestic | -57 | -54 | -53 | -60 | 23.2 | 140 |
| Foreign | -56 | -59 | -57 | -63 | 24.5 | 138 |
| Inventories | -7 | -1 | -6 | 0 | 27.6 | 126 |
| Production | -52 | -51 | -55 | -58 | 21.0 | 139 |
| INVESTMENT GOODS | ||||||
| Order books & Demand | ||||||
| Total | -62 | -61 | -63 | -69 | 10.5 | 139 |
| Domestic | -54 | -55 | -56 | -63 | 21.0 | 137 |
| Foreign | -66 | -61 | -59 | -72 | 6.3 | 142 |
| Inventories | -1 | -1 | 4 | 8 | 43.2 | 98 |
| Production | -61 | -58 | -56 | -67 | 5.9 | 143 |
| CONSUMER GOODS | ||||||
| Order books & Demand | ||||||
| Total | -36 | -38 | -37 | -37 | 26.1 | 138 |
| Domestic | -36 | -39 | -35 | -37 | 29.0 | 139 |
| Foreign | -41 | -42 | -36 | -39 | 22.9 | 140 |
| Inventories | -1 | 1 | 3 | -1 | 38.5 | 98 |
| Production | -37 | -33 | -31 | -35 | 15.8 | 143 |
| Total number of months: | 148 | |||||
by Tom Moeller October 28, 2009
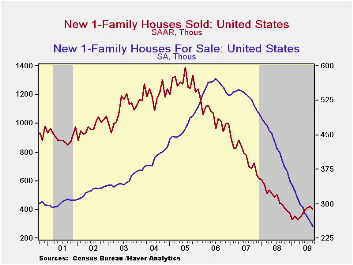
The recovery in the housing market stuttered last month. Sales of new single-family homes fell during September following five consecutive months of increase. The seasonally adjusted annual sales rate of 402,000 followed a downwardly revised August level of 417,000 and it fell well short of Consensus expectations for a rise to 440,000 sales. Nevertheless, sales have risen by nearly one-quarter from the January low.
Home prices firmed last month, but the recovery this year has
been tepid. The median price of a new single-family home rose to
$204,800 from an upwardly revised August level. Nevertheless the latest
figure, which was down 9.1% y/y, remained near the lowest level since
October of 2003. The average price of a new home was less weak and off
1.6% y/y.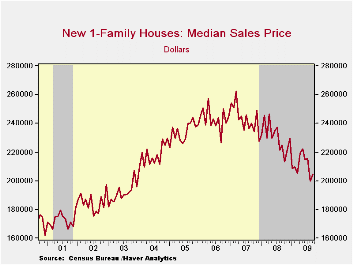
Price discounts, higher sales and much lower housing starts have combined to lower the overhang of unsold homes. A September decline dropped them by more than one-third versus last year to the lowest level since 1982 (no typo). In the West the number of homes for sale fell by nearly one-half to a record low while inventories elsewhere in the country fell by roughly one-third.
The months' supply of unsold homes held steady last month at 7.5 months and was down from the high of 12.4 months in January. The figure was the lowest since January 2007.
The Global Financial Crisis and Offshore Dollar Markets from the Federal Reserve Bank of New York can be found here here .
| US New Homes | September | August | July | Y/Y | 2008 | 2007 | 2006 |
|---|---|---|---|---|---|---|---|
| Total Sales (SAAR, 000s) | 402 | 417 | 413 | -7.8% | 481 | 769 | 1,049 |
| Northeast | 42 | 42 | 41 | 68.0 | 35 | 64 | 64 |
| Midwest | 71 | 53 | 56 | 12.7 | 69 | 118 | 161 |
| South | 188 | 209 | 215 | -11.1 | 264 | 408 | 559 |
| West | 101 | 113 | 101 | -1.0 | 113 | 178 | 266 |
| Median Price (NSA, $) | 204,800 | 199,900 | 215,600 | -9.1 | 230,408 | 243,742 | 243,067 |

Tom Moeller
AuthorMore in Author Profile »Prior to joining Haver Analytics in 2000, Mr. Moeller worked as the Economist at Chancellor Capital Management from 1985 to 1999. There, he developed comprehensive economic forecasts and interpreted economic data for equity and fixed income portfolio managers. Also at Chancellor, Mr. Moeller worked as an equity analyst and was responsible for researching and rating companies in the economically sensitive automobile and housing industries for investment in Chancellor’s equity portfolio. Prior to joining Chancellor, Mr. Moeller was an Economist at Citibank from 1979 to 1984. He also analyzed pricing behavior in the metals industry for the Council on Wage and Price Stability in Washington, D.C. In 1999, Mr. Moeller received the award for most accurate forecast from the Forecasters' Club of New York. From 1990 to 1992 he was President of the New York Association for Business Economists. Mr. Moeller earned an M.B.A. in Finance from Fordham University, where he graduated in 1987. He holds a Bachelor of Arts in Economics from George Washington University.
More Economy in Brief