 Global| May 24 2007
U.S. Durable Goods Orders: Rise and Shine: A New Dawn?
Summary
Durable goods orders now show signs of growth, shaking off some of the weaker performance from late last year and early 2007. The 0.6% headline marks the third straight month of orders increases. Order backlog growth continues to be [...]
Durable goods orders now show signs of growth, shaking off some of the weaker performance from late last year and early 2007. The 0.6% headline marks the third straight month of orders increases. Order backlog growth continues to be strong as well. Excluding aircraft, nondefense capital goods orders are up strongly for two straight months. Shipments and most cuts on capital goods shipments were strong in the month.
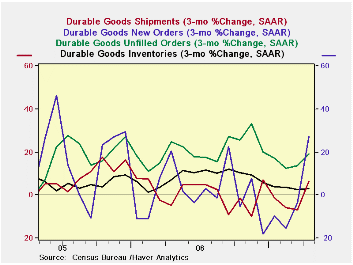
The chart for durable goods looks immediately better.
While three-month growth rates for durable goods can be very volatile, the graphs on the left documents a strong rise in new orders. A reversal (one month only) in shipments growth now shows advance instead of decline. And, more impressive, is the reduction in the rate of slowing for the declining pace of inventory growth. If firms are no longer seeking to cut inventory growth that could be very helpful to the sector assuming, of course, that the shipment pick up and order pick up are for real.
Diffusion to relieve confusion…
The statistics in the table below show that suddenly durable goods shipments and orders join unfilled orders in revealing that growth is broad-based across industries. Our (proprietary) diffusion readings are generally in the 70s or higher; 50 is neutral. These readings look for acceleration in sequential annualized growth rates (3-month Vs six-month, six-month Vs Yr/Yr, Yr/Yr Vs Yr ago, etc). We obtain these results from calculations of annualized growth rates performed across the main durables sectors. Diffusion calculations are helpful in this many-faceted report to distill common themes from an otherwise confusing array of components and subcomponent constructions. As of April, the various reading have begun to show signs of strength across most main sectors.
Sales have begun to exceed inventory growth in most industries over three and six months but are still lower in most for year/year growth (diffusion of 0.14 on this basis). Still, that weakness is an air-pocket of sorts since sales have begun to outpace inventories again just as they had done so one year ago. The report seems to show that the period of distress may have been put behind us even though the month’s reading was no clarion call to growth. It was however a step in the right direction that followed two previous stronger steps.
Orders in the once weak machinery category have broken higher. Primary metals orders again are very strong and transportation orders are strong again. Shipments data show some spottiness across industries but where there is strength it is very strong: primary metals, machinery and electrical equipment.
The report is the most upbeat from durables that we have seen for sometime.
| 3Mo | 6Mo | 9Mo | 12Mo | Year Ago | |
| Durables Diffusion | |||||
| Shipments | 71.4 | 85.7 | 71.4 | 85.7 | 100.0 |
| Orders | 100.0 | 71.4 | 42.9 | 57.1 | 100.0 |
| Unfilled Orders | 100.0 | 100.0 | 85.7 | 100.0 | 85.7 |
| Inventories | 71.4 | 85.7 | 100.0 | 100.0 | 100.0 |
| S>I Diffusion | 85.7 | 57.1 | 28.6 | 14.3 | 57.1 |
by Robert Brusca May 24, 2007
New home sales were revised lower in March but still managed to jump sharply to post a much stronger selling rate in April than had been expected. The jump of 16.2% m/m reverses out the weakening trend in housing. Sales are still down year/year but only by 10.6%. Conditions are still spotty. While Toll Brothers reported somewhat improved results, that home builder is still not comfortable enough with prospects to give earnings guidance. However, it did say that it had seen glimmerings of strength- not just an abatement of weakness.
The new home sales report shows the small and volatile Northeast up by 43% Y/Y and the largest region, the South, off by just 3.4% Y/Y. The West and Midwest are off by Y/Y values in the range of 25% to 30%.
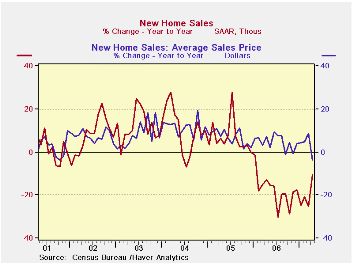
Cleary the rise in sales is the big news in this report. But a rival bit of news is the drop in prices. Last month average and median pries were up Y/Y. But Median prices have swung from +7.9% Y/Y in March to -10.9% Y/Y in April. What’s that line from Frank’s song? Riding high in March, shot down in April …hmmm not quite the verse, but those are the facts. Average prices have switched from a March gain of 8.7% Y/Y to a drop of 3.6% Y/Y in April. The relatively larger drop in median prices speaks of more weakness at the lower priced end of the market and may have something to do with sub-prime problems. Cleary builders have been cutting prices and just as clearly, the strategy has been working.
If we look at trends in average new home prices around the time of the last recession, we see that builder capitulation on prices was the catalyst in that recession for spurring house prices back up and for ending the weakness in the sector as recovery took hold in the economy at large. House prices then snapped back up into a positive growth range quickly as the economy transitioned from recession to growth. House prices could be performing this same function again. The low prices jump start demand and get some inventory off homebuilder’s hands giving the market a push and creating some buzz at the same time. With continued growth in the rest of the economy housing is able to move ahead and dig itself out of the slump. It looks like a good story to me…Oh, and they all live happily ever after, too.
| Momentum: Annualized Rates Of Change | Prices | ||||||
| As of: | Total | Northeast | Midwest | South | West | Median | Average |
| Month-to-month percent change | |||||||
| Apr.07 | 16.2% | 3.8% | -4.0% | 27.8% | 8.5% | -11.1% | -7.9% |
| Mar.07 | -1.4% | 77.8% | 1.6% | -8.9% | -2.9% | 3.0% | 0.7% |
| Feb.07 | -3.8% | -27.4% | -25.9% | -2.0% | 21.2% | -1.7% | 2.5% |
| Annualized Rates | |||||||
| Total | Northeast | Midwest | South | West | Median | Average | |
| 3-Mo | 40.9% | 135.5% | -110.8% | 56.1% | 110.6% | -34.2% | -18.3% |
| 6-Mo | 6.1% | 225.6% | -24.8% | 12.9% | -25.7% | -16.3% | -5.0% |
| 1-Yr | -10.6% | 43.1% | -28.1% | -3.4% | -25.4% | -10.9% | -3.6% |
by Robert Brusca Germany’s IFO Steadies But Index Shows Threat of Decay May 24, 2007
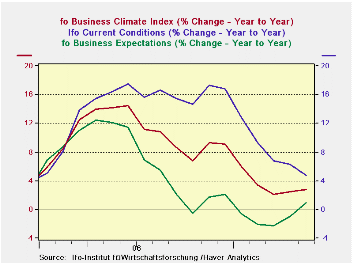
Germany’s IFO index steadied at 108.6 in May a tick below its current cycle peak at 108.7 reached in December 2006. The reading continues to be a strong one and it is said to point to further expansion. But the index is slowing its rate of ascent, as the accompanying chart shows. On that score the good news this month is that expectations improved (to 104.8 in May from 104.3 in April) and that was enough to hike the growth rate for expectations and stave off a decay in the growth of the overall index. The index’s peak growth rate came in mid- 2006 and it has been slowing ever since. The pace of decline reached a local low in March of this year but the renewed upward momentum in the growth rate is without conviction. Right now the trend is up for grabs even though the expectations index moved into a positive growth phase this month following four straight months of negative readings. The current situation index continues to improve at a decelerating pace.
While the index is said to portray conditions of continuing growth, we can see the opposite signal may well be waiting in the wings to supplant it.
The diffusion readings for the IFO are up to date for May although much of the sector detail for this report is held back for another week. The diffusion indexes show us that overall conditions have been little changed month to month. The overall diffusion index is a tick lower at 16.3. Manufacturing is a bit stronger moving up to 27.6 from 27.1. Construction, however, is slipping. The wholesale sector improved sharply in May rising to 18.4 from a 17.2 in April to 18.4 in May. Retail, however gave ground as did the services sector.
However the service sector is still at a relatively strong reading in its range (top 5%), while retailing is weak (middle of range at 56.6 percentile). Manufacturing is still the flagship of strength sitting at the top of its range of values back to 1991.
| CLIMATE Sum | Current | Since Jan 1991* | ||||||
| May-07 | Apr-07 | Average | Median | Max | Min | Range | % Range | |
| All Sectors | 16.3 | 16.4 | -8.8 | -9.6 | 16.5 | -30.6 | 47.1 | 99.6% |
| Manufacturing | 27.6 | 27.1 | -1.2 | 0.3 | 27.6 | -35.6 | 63.2 | 100.0% |
| Construction | -14.6 | -13.9 | -29.1 | -32.2 | 1.4 | -50.7 | 52.1 | 69.3% |
| Wholesale | 18.4 | 17.2 | -14.8 | -16.5 | 23.3 | -39.6 | 62.9 | 92.2% |
| Retail | -3.2 | -0.5 | -14.7 | -14.8 | 25.2 | -40.3 | 65.5 | 56.6% |
| Services | 26.5 | 28.5 | 8.2 | 7.8 | 28.5 | -15.7 | 44.2 | 95.5% |
| * May 2001 for Services | ||||||||
by Carol Stone Canada Corporations Operating Profits Bolstered by Higher Commodity Prices, But ROE Edges Down May 24, 2007
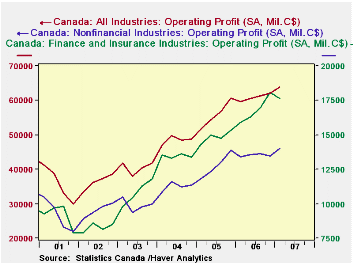
Corporate profits in Canada picked up vigorously in Q1, by 12.2% at an annual rate over Q4 2006 to C$63.8 billion, a record high. While profits have expanded more strongly in recent years, they had slowed in 2006, so this was the best performance since Q4 2005.
As might be expected, the gain was generated in commodity-related industries, where prices have been rising rapidly. A prime example is the oil & gas sector, which staged something of a rebound from a steep decline in Q4. Metals processing industries within the manufacturing sector also saw increases, with manufacturing as a whole up 7.4% on the quarter (at a quarterly rate) and 15.2% from a year ago. Manufacturing profits, as evident in the second graph, struggled in 2005 and 2006, so this Q1 year-on-year performance is the best since late 2004.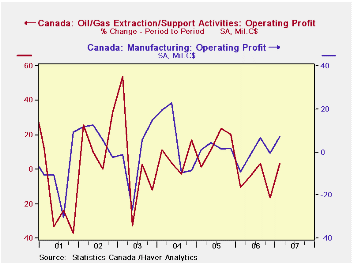
Among non-manufacturing sectors, retailing, information and culture, and business services had bounces in their operating profits after weak periods. Real estate and transportation extended trends of less dramatic but consistent growth.
Financial industries, in contrast, saw their profits fall, particularly among security dealers and insurance companies. The financial sector as a whole experienced a decline of 2.5% on the quarter; however, they had been strong in Q4, so the year-on-year result was up 10.4%.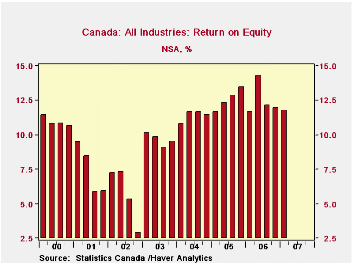
These generally good operating results were offset by lower non-operating revenues and higher expenses and taxes, so that profits after tax rose only slightly, from C$41.6 billion in Q4 to C$42.0 billion. On a not seasonally adjusted basis, this was actually a small decline from Q4, cutting the rate of return on shareholders' equity from 11.94% to 11.76%.
All of these data are contained in Haver's CANSIM database from Statistics Canada.The profits series are reported under "National Accounts", and the non-operating data in "Balance Sheet and Income Statement" and "Statement of Change in Cash Position" in the "Financial" section. Data are available for 17 nonfinancial industries and five financial industries.
| CANADA, Bil.C$ | Q1 2007* | Q4 2006* | Q1 2006* | Quarterly Averages|||
|---|---|---|---|---|---|---|
| 2006 | 2005 | 2004 | ||||
| Total Operating Profit | 63.8 | 62.0 | 59.6 | 60.9 | 55.9 | 48.5 |
| % Change (Qtrs at Ann Rate) |
12.2% | 4.1% | 7.5% (Yr/Yr) | 8.8% | 15.3% | 19.9% |
| Nonfinancial Industries | 46.2 | 43.9 | 43.8 | 44.1 | 41.1 | 35.1 |
| Oil & Gas Extraction | 7.4 | 7.1 | 8.6 | 8.1 | 7.4 | 5.1 |
| Manufacturing | 11.8 | 10.9 | 10.5 | 10.7 | 11.1 | 11.3 |
| Finance & Insurance | 17.6 | 18.1 | 15.9 | 16.8 | 14.9 | 13.5 |
| Total Net Profit | 42.0 | 41.6 | 37.8 | 42.1 | 39.4 | 33.1 |

Robert Brusca
AuthorMore in Author Profile »Robert A. Brusca is Chief Economist of Fact and Opinion Economics, a consulting firm he founded in Manhattan. He has been an economist on Wall Street for over 25 years. He has visited central banking and large institutional clients in over 30 countries in his career as an economist. Mr. Brusca was a Divisional Research Chief at the Federal Reserve Bank of NY (Chief of the International Financial markets Division), a Fed Watcher at Irving Trust and Chief Economist at Nikko Securities International. He is widely quoted and appears in various media. Mr. Brusca holds an MA and Ph.D. in economics from Michigan State University and a BA in Economics from the University of Michigan. His research pursues his strong interests in non aligned policy economics as well as international economics. FAO Economics’ research targets investors to assist them in making better investment decisions in stocks, bonds and in a variety of international assets. The company does not manage money and has no conflicts in giving economic advice.
More Economy in Brief


