 Global| Aug 24 2005
U.S. Durable Goods Orders Down in July, But May & June Revised Upward
Summary
New orders for durable goods fell 4.9% last month, with decreases across several industries. Consensus expectations had been for a 1.4% decline. The increase in June's total orders was revised higher, from 1.4% reported initially to [...]
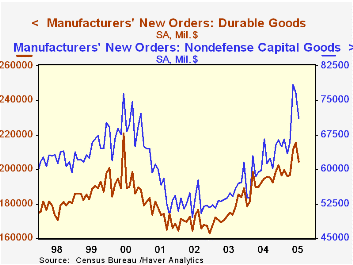
New orders for durable goods fell 4.9% last month, with decreases across several industries. Consensus expectations had been for a 1.4% decline.
The increase in June's total orders was revised higher, from 1.4% reported initially to 1.9% in today's data. The gain in May was also raised, from 6.4% to 7.3%. These revisions encompass the usual monthly refinements plus the annual benchmarking, which was published last Friday. In that revision, total durable goods orders for 2004 were reduced by 0.6%.
July's orders for fabricated metals products, machinery and electronics were all down after sizable increases in June. Transportation orders fell 8.6%; they also declined in June, but they were up 23.5% in May. This last sector also saw sizable upward revisions: the May level was raised $4.1 billion or 6.4% in the annual revisions. By contrast, computer sector orders were chopped $5.3 billion or 15.0% for May; for June, today's data resulted in an originally reported 8.7% rise being cut to just 0.8%, with an 8.3% fall coming in July. Thus, the modest 0.6% revision for 2004 as a whole reflects widely varying revisions to individual industries. Transportation looks stronger, but computers considerably lower than before.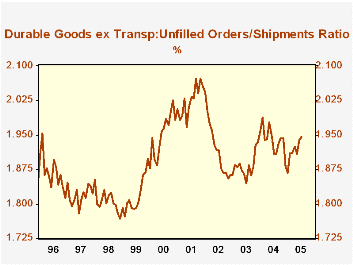
Orders for aircraft & parts continued to decline in July, a second sharp drop after their spike in May. Nondefense capital goods fell 7.3% last month, including the drop in aircraft and a 3.7% fall in other capital goods orders.
Shipments of durable goods eased 0.1% in July, continuing a recent trend of minimal monthly changes. Inventories rose 0.6% after a 0.4% fall in June. Order backlogs rose 1.0%, a third consecutive sizable increase, despite the volatility in new orders. The ratio of backlogs to shipments rose to 2.81, the highest since early 2002. Excluding transportation, this ratio was 1.95, the highest since June 2004.
| NAICS Classification | July | June | Y/Y | 2004 | 2003 | 2002 |
|---|---|---|---|---|---|---|
| Durable Goods Orders | -4.9% | 1.9% | 5.0% | 9.5% | 4.1% | -3.4% |
| Excluding Transportation | -3.2% | 3.6% | 7.6% | 11.7% | 3.1% | -6.2% |
| Nondefense Capital Goods | -7.3% | -2.2% | 6.7% | 11.0% | 4.2% | -9.8% |
| Excluding Aircraft | -3.7% | 4.8% | 8.4% | 9.5% | 4.8% | -10.5% |
Carol Stone, CBE
AuthorMore in Author Profile »Carol Stone, CBE came to Haver Analytics in 2003 following more than 35 years as a financial market economist at major Wall Street financial institutions, most especially Merrill Lynch and Nomura Securities. She had broad experience in analysis and forecasting of flow-of-funds accounts, the federal budget and Federal Reserve operations. At Nomura Securities, among other duties, she developed various indicator forecasting tools and edited a daily global publication produced in London and New York for readers in Tokyo. At Haver Analytics, Carol was a member of the Research Department, aiding database managers with research and documentation efforts, as well as posting commentary on select economic reports. In addition, she conducted Ways-of-the-World, a blog on economic issues for an Episcopal-Church-affiliated website, The Geranium Farm. During her career, Carol served as an officer of the Money Marketeers and the Downtown Economists Club. She had a PhD from NYU's Stern School of Business. She lived in Brooklyn, New York, and had a weekend home on Long Island.
More Economy in Brief


