 Global| Jul 29 2009
U.S. Durable Goods Orders DeclineLed By Aircraft & Computers; Lower Inventories May Set Stage for Rebound
by:Tom Moeller
|in:Economy in Brief
Summary
The recent improvement in factory sector activity stuttered last month as June durable goods orders fell. The 2.5% decline reversed nearly all of the increases during the prior two months. Moreover, the May increase was revised [...]
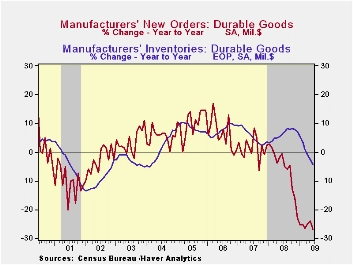
The recent improvement in factory sector activity stuttered last month as June durable goods orders fell. The 2.5% decline reversed nearly all of the increases during the prior two months. Moreover, the May increase was revised weaker. Consensus expectations had been for a lesser 0.6% drop. That's not to say that the recent improvement in factory sector orders was totally reversed last month. Most of the latest decline was due to lower orders for aircraft. On a three-month basis durable goods orders less the transportation sector overall have risen at a 7.2% annual rate.
Perhaps setting the stage for an orders rebound is the lower
level of factory inventories. Inventories of durable goods fell for the
sixth consecutive month. The 0.9% decline (-4.3% y/y) followed a 1.1%
May decline that was deeper than reported initially. Notable, though,
has been the vigor of the recent cutback of unwanted inventories
On a three-month basis, decumulation of durable goods
inventories continued last month at a near-record 12.3% annual rate.
Decumulation of inventories has been notable across industries, but
especially so in the metals, machinery and motor vehicle sectors. 
Lower new orders for transportation equipment paced last
month's decline in the total. The 12.8% m/m decline followed a 2.7%
gain during May. Notably weak were orders for commercial aircraft which
fell 38.5% (-61.0% y/y), reversing all of the strong gain during May.
In addition, orders for motor vehicles & parts fell 1.0%
(-31.8% y/y) following the 8.7% May decline, prompted by lower sales.
Adding to this weakness was a 2.5% decline in orders for computers
& electronic products (-15.1% y/y) which returned them to the
lowest level since January. Computer orders slipped just 1.2% (-17.3%
y/y) after a strong May but orders for communications equipment fell a
hard 10.8% (-26.2% y/y) to their lowest level since late-2005. Moving
the other way were machinery orders which posted a 4.4% increase
(-26.3% y/y) after a firm May gain. Orders for primary metals were even
stronger as they posted an 8.9% increase but that nevertheless left
them off by nearly one-half from their year ago level. Electrical
equipment orders were up just 0.9% (-31.1% y/y) following large
declines during May and April.
The recent improvement in the capital goods sector indeed stuttered last month. Orders for nondefense capital goods fell 3.4% as aircraft orders plunged. Conversely, orders excluding aircraft rose for a second month. The 1.4% increase followed a stronger May gain and that was enough to raise orders to their highest level this year. During the last ten years there has been an 80% correlation between the y/y change in nondefense capital goods orders and the change in equipment & software spending in the GDP accounts. The correlation of the GDP figure with capital goods shipments is, as one would expect, a larger 92%.
Despite the improvement in orders, shipments of durable goods continued to languish. Shipments of durable goods slipped 0.2% (-21.0% y/y) last month and have fallen in each month since February of last year. That y/y decline in shipments has been accompanied by a 21.9% y/y drop in industrial production of durable goods which has shown little or no sign of turning around. During the last ten years, there has been an 80% correlation between the change in shipments of durable goods and the change in durables industrial production.
The durable goods figures are available in Haver's USECON database.
Monetary Policy in the 2008--2009 Recession from the Federal Reserve Bank of Richmond is available here.
| NAICS Classification (%) | June | May | Y/Y | 2008 | 2007 | 2006 |
|---|---|---|---|---|---|---|
| Durable Goods Orders | -2.5 | 1.3 | -26.8 | -5.8 | 1.4 | 6.2 |
| Excluding Transportation | 1.1 | 0.8 | -24.1 | -1.2 | -0.3 | 9.1 |
| Nondefense Capital Goods | -3.4 | 9.1 | -28.8 | -6.8 | 3.5 | 9.4 |
| Excluding Aircraft | 1.4 | 4.3 | -22.8 | -0.3 | -2.7 | 10.7 |
by Robert Brusca July 29, 2009
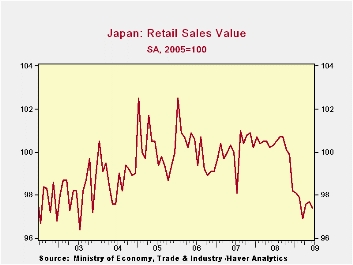
Japan retail sales fell in June but June caps a three-month
period in which sales have expanded. Still, in the quarter-to-date
Japan’s retail sales are falling but only slightly.
Over 12-months retail sales are off by about 3%, led by
declines in fabric and apparel and the rest of retail which dropped by
4.2%. Auto sales are only off by 0.5% Yr/Yr. Food and beverage sales
are off by 1.2%. Sales at department stores and supermarkets slipped
6.7% on the year, and after those figures are adjusted for the number
of stores (same-store sales), sales posted their 15th straight monthly
decline, according to METI.
This is hardly a robust picture of activity yet today the MoF
upgraded its assessment of Japan’s economy for the first time in five
years. The Ministry of Economy, Trade and Industry said. The
government's massive stimulus measures, which include tax-cut programs
such as incentives to buy new cars, may help to boost retail sales in
the future. For now the consumer is in the doldrums and spending habits
remain subdued. Leading indicators for Japan have not turned the corner
to signal positive trends yet.
| Jun-09 | May-09 | Apr-09 | 3-mo | 6-mo | 12-mo | Yr-Ago | Q-to-Date | |
| Total SA | -0.3% | 0.1% | 0.7% | 2.1% | -1.6% | -2.9% | 1.2% | -0.3% |
| Not seasonally adjusted | ||||||||
| Total: Nominal | -0.5% | 0.5% | 0.3% | 1.1% | -0.8% | -3.0% | 0.7% | -0.7% |
| Motor Vehicles | -1.9% | -4.1% | 7.5% | 4.7% | -5.7% | -0.5% | -3.2% | 3.0% |
| Food& Beverage | -1.4% | 2.0% | -1.0% | -2.0% | -3.7% | -1.2% | 14.8% | -1.0% |
| Fabric apparel& access | -4.5% | 1.4% | 1.5% | -6.5% | -1.0% | -5.7% | -6.6% | 2.5% |
| Rest of Retail | 1.1% | 0.4% | -0.7% | 3.5% | 2.3% | -4.2% | -5.0% | -1.9% |

Tom Moeller
AuthorMore in Author Profile »Prior to joining Haver Analytics in 2000, Mr. Moeller worked as the Economist at Chancellor Capital Management from 1985 to 1999. There, he developed comprehensive economic forecasts and interpreted economic data for equity and fixed income portfolio managers. Also at Chancellor, Mr. Moeller worked as an equity analyst and was responsible for researching and rating companies in the economically sensitive automobile and housing industries for investment in Chancellor’s equity portfolio. Prior to joining Chancellor, Mr. Moeller was an Economist at Citibank from 1979 to 1984. He also analyzed pricing behavior in the metals industry for the Council on Wage and Price Stability in Washington, D.C. In 1999, Mr. Moeller received the award for most accurate forecast from the Forecasters' Club of New York. From 1990 to 1992 he was President of the New York Association for Business Economists. Mr. Moeller earned an M.B.A. in Finance from Fordham University, where he graduated in 1987. He holds a Bachelor of Arts in Economics from George Washington University.
More Economy in Brief


