 Global| Aug 24 2007
U.S. Durable Goods Orders Better Due To Transportation
by:Tom Moeller
|in:Economy in Brief
Summary
New orders for durable goods during July gained an impressive 5.9% and the gain during the prior month was revised up slightly to 1.9%. Consensus expectations had been for a 2.0% rise in orders for last month. During the last ten [...]
New orders for durable goods during July gained an impressive 5.9% and the gain during the prior month was revised up slightly to 1.9%. Consensus expectations had been for a 2.0% rise in orders for last month.
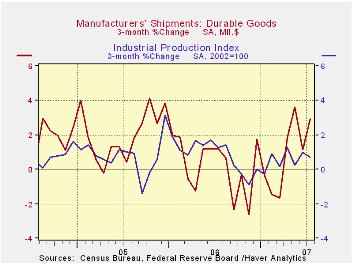
During the last ten years there has been a 67% correlation between the y/y change in durable goods orders and the change in production of durable goods.
The rise in new orders less the transportation category for July, however, was a less impressive 1.3% ... less impressive especially since it followed a 2.5% flop in June.
Changing new orders for motor vehicles & parts caused much of this volatility with a 9.8% rise last month after a 0.7% decline during June. And the aircraft sector got into the act with a 13.0% rise last month which was roughly a third of the 31.4% spike during June. 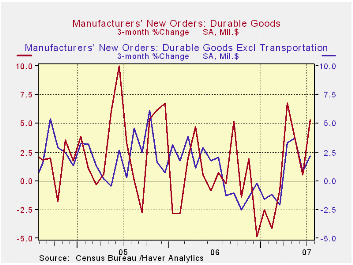
Orders for nondefense capital goods rose 5.8% during July following the 6.4% June increase which was revised up slightly. (Orders in May fell 6.8%.) Still, excluding aircraft & parts July orders rose a modest 2.2% following two months of decline The y/y change is roughly zero. During the last ten years there has been an 84% correlation between the y/y change in capital goods orders less aircraft and the y/y change in business fixed investment in equipment & software from the GDP accounts.
Orders for computers & electronic products also have been volatile. They rose 7.4% (+1.8% y/y) after a little revised 2.8% June decline. Orders for just computers & related products fell 4.0% (-8.4% y/y) for the second month of sharp decline. Primary metals orders rose 7.9% (-0.5% y/y) but that only lifted orders back about to where they were in March. And electrical equipment orders fell for the third consecutive month (+0.2% y/y). Machinery orders were the strongest area with a 5.5% (4.4% y/y) increase following a 3.4% June gain.
Shipments of durable goods rose 3.8% (4.2% y/y) after a 1.1% June slip. Less the transportation sector, shipments made up declines during the prior two months with a 1.9% (1.3% y/y) increase. During the last ten years there has been an 82% correlation between the y/y change in durable goods shipments and the change in industrial production of durable goods. The July increase less transportation amounted to 1.9% (1.3% y/y).
| NAICS Classification | July | June | Y/Y | 2006 | 2005 | 2004 |
|---|---|---|---|---|---|---|
| Durable Goods Orders | 5.9% | 1.9% | 8.1% | 6.3% | 9.9% | 5.3% |
| Excluding Transportation | 1.3% | -2.5% | 1.3% | 7.6% | 8.8% | 7.9% |
| Nondefense Capital Goods | 5.8% | 6.4% | 14.2% | 10.6% | 17.1% | 5.7% |
| Excluding Aircraft | 2.2% | -0.1% | 0.2% | 8.5% | 11.1% | 3.2% |

Tom Moeller
AuthorMore in Author Profile »Prior to joining Haver Analytics in 2000, Mr. Moeller worked as the Economist at Chancellor Capital Management from 1985 to 1999. There, he developed comprehensive economic forecasts and interpreted economic data for equity and fixed income portfolio managers. Also at Chancellor, Mr. Moeller worked as an equity analyst and was responsible for researching and rating companies in the economically sensitive automobile and housing industries for investment in Chancellor’s equity portfolio. Prior to joining Chancellor, Mr. Moeller was an Economist at Citibank from 1979 to 1984. He also analyzed pricing behavior in the metals industry for the Council on Wage and Price Stability in Washington, D.C. In 1999, Mr. Moeller received the award for most accurate forecast from the Forecasters' Club of New York. From 1990 to 1992 he was President of the New York Association for Business Economists. Mr. Moeller earned an M.B.A. in Finance from Fordham University, where he graduated in 1987. He holds a Bachelor of Arts in Economics from George Washington University.
More Economy in Brief


