 Global| Jun 16 2006
U.S. Current Account Deficit Narrowed Unexpectedly
by:Tom Moeller
|in:Economy in Brief
Summary
The US current account deficit narrowed last quarter to $208.7B versus a revised record during 4Q '05 of $223.1B. The deficit during 1Q '06 equaled 6.4% of GDP, about stable with 6.3% for all of last year . Consensus expectations had [...]
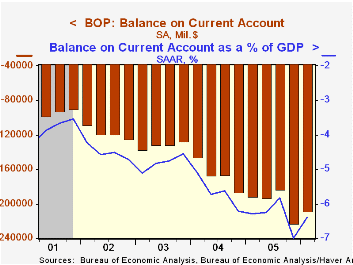
The US current account deficit narrowed last quarter to $208.7B versus a revised record during 4Q '05 of $223.1B. The deficit during 1Q '06 equaled 6.4% of GDP, about stable with 6.3% for all of last year .
Consensus expectations had been for a 1Q deficit of $222.0B. Much of the surprise was narrowing of the unilateral transfers deficit to $19.9B from $26.2B during 4Q '05.
The deficit in merchandise trade improved to $208B from the record $212.5B in 4Q which was little revised. Exports jumped another 5.0% (14.2% y/y) while imports grew just 1.6% (13.8% y/y).
The surplus in services trade fell slightly to $17.2B from an upwardly revised $17.7B surplus during 4Q. Exports of services grew 1.9% (8.4% y/y) while imports grew 3.0% (7.3% y/y), the strongest quarterly growth since 4Q '04.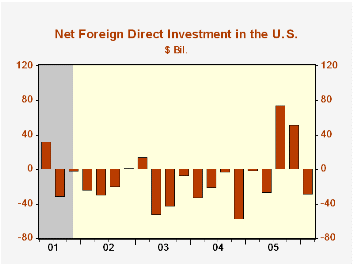
From the capital account, net US foreign direct investment abroad fell sharply to $61.8B, its weakest since 4Q '04. Foreign direct investment in the US, however, rose to $33.3B (9.0% y/y).
Energy and the Economy, yesterday's speech by Fed Chairman Ben S. Bernanke, is available here.
| US Int'l Balance of Payments | 1Q 06 | 4Q '05 | Y/Y | 2005 | 2004 | 2003 |
|---|---|---|---|---|---|---|
| Current Account Deficit | $208.7 | $223.1B | $191.7B (1Q05) | $791.5B | $665.3B | $527.5B |
| Goods/Services/Income Deficit | $188.8 | $196.9B | $164.5B | $705.4B | $583.7B | $458.3B |
| Exports | 5.0% | 4.4% | 16.9% | 14.6% | 15.7% | 5.9% |
| Imports | 2.3% | 6.9% | 16.3% | 16.3% | 18.7% | 7.4% |
| Unilateral Transfers Deficit | $19.9B | $26.2B | $27.2B | $86.1B | $81.6B | $69.2B |
by Tom Moeller June 16, 2006
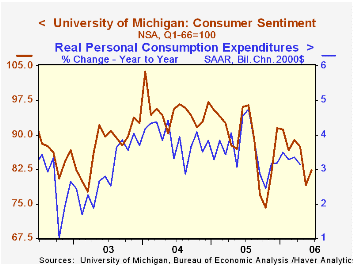
Consumer sentiment early this month improved according to the University of Michigan. The preliminary June index rose to 82.4 from a low 79.1 during May but recovered less than half of that month's decline. Consensus expectations had been for a further slide to 78.5.
During the last ten years there has been a 77% correlation between the level of consumer sentiment and the y/y change in real consumer spending.
The reading of current economic conditions recovered more than half of the May decline with a 7.3% increase as the index of current personal finances rose 9.8% (-8.2% y/y). The reading of buying conditions for large household goods also recouped half of the May decline with a 5.4% (-9.9% y/y) increase.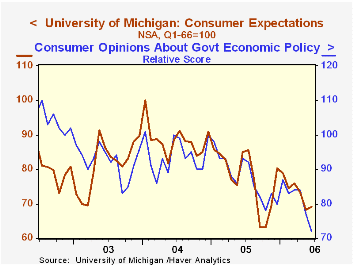
Expectations for the economy improved a modest 1.5% after the 7.1% slide during May, bolstered by slightly improved expectations for personal finances and buying conditions during the next year. But long term (5 year) expectations for buying conditions fell a sharp 7.5% (-28.2% y/y) as consumers' opinion about gov't economic policy cratered another 6.5% m/m (-22.6% y/y) to the lowest level since 1993.
Expected inflation during the next year slipped modestly to 4.6% but the five to ten year expected rate of inflation rose to 3.8%, near the nine year high.
The University of Michigan survey is not seasonally adjusted.The mid-month survey is based on telephone interviews with 250 households nationwide on personal finances and business and buying conditions. The survey is expanded to a total of 500 interviews at month end.
Why Are Yield Curves So Flat and Long Rates So Low Globally? is a speech by Fed Governor Randall S. Kroszner and can be found here.
The latest Beige Book covering regional economic conditions from the Federal Reserve Board can be found at this link.
| University of Michigan | June (Prelim. | May | Y/Y | 2005 | 2004 | 2003 |
|---|---|---|---|---|---|---|
| Consumer Sentiment | 82.4 | 79.1 | -14.2% | 88.6 | 95.2 | 87.6 |
| Current Conditions | 103.1 | 96.1 | -8.9% | 105.9 | 105.6 | 97.2 |
| Expectations | 69.2 | 68.2 | -18.6% | 77.4 | 88.5 | 81.4 |
by Tom Moeller June 16, 2006
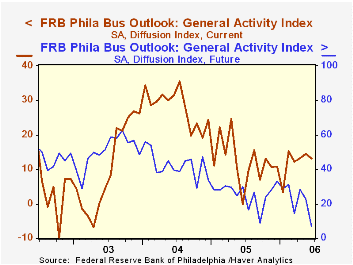
The Index of General Business Conditions in the manufacturing sector during June from the Philadelphia Fed dipped to 13.1 from an unrevised 14.4 during May. The decline was less than the Consensus expectation for a drop to 11.5.
During the last ten years there has been a 65% correlation between the level of the Philadelphia Fed Business Conditions Index and three month growth in factory sector industrial production. There has been a 49% correlation with q/q growth in real GDP.
The index reflected declines in the sub indexes of delivery time and inventories. New orders and shipments recovered all or most of the sharp declines in May while employment recovered moderately. During the last ten years there has been a 75% correlation between the employment index and the three month growth in factory payrolls.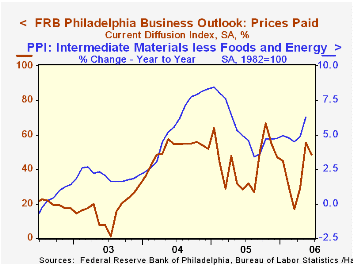
The business conditions index reflects a separate survey question, not the sub indexes.
The prices paid index gave back a piece of the May surge but remained quite elevated . During the last ten years there has been a 76% correlation between the prices paid index and the three month growth in the intermediate goods PPI. There has been an 85% correlation with the change in core intermediate goods prices.
The separate index of expected business conditions in six months fell sharply to its lowest level since January of 2001 although expectations for employment improved.
The latest Business Outlook survey from the Philadelphia Federal Reserve Bank can be found here.
The Effects of Globalization on Inflation and Their Implications for Monetary Policy is yesterday's speech by Federal Reserve Board Governor Donald L. Kohn and it is available herel
| Philadelphia Fed Business Outlook | June | May | June '05 | 2005 | 2004 | 2003 |
|---|---|---|---|---|---|---|
| General Activity Index | 13.1 | 14.4 | 0.0 | 12.4 | 28.0 | 10.5 |
| Prices Paid Index | 48.7 | 55.3 | 28.2 | 43.5 | 51.2 | 16.8 |

Tom Moeller
AuthorMore in Author Profile »Prior to joining Haver Analytics in 2000, Mr. Moeller worked as the Economist at Chancellor Capital Management from 1985 to 1999. There, he developed comprehensive economic forecasts and interpreted economic data for equity and fixed income portfolio managers. Also at Chancellor, Mr. Moeller worked as an equity analyst and was responsible for researching and rating companies in the economically sensitive automobile and housing industries for investment in Chancellor’s equity portfolio. Prior to joining Chancellor, Mr. Moeller was an Economist at Citibank from 1979 to 1984. He also analyzed pricing behavior in the metals industry for the Council on Wage and Price Stability in Washington, D.C. In 1999, Mr. Moeller received the award for most accurate forecast from the Forecasters' Club of New York. From 1990 to 1992 he was President of the New York Association for Business Economists. Mr. Moeller earned an M.B.A. in Finance from Fordham University, where he graduated in 1987. He holds a Bachelor of Arts in Economics from George Washington University.
More Economy in Brief


