 Global| May 15 2009
U.S. CPI Unchanged in April; Year-to-Year Drop of 0.7% Is Largest Since 1955
by:Tom Moeller
|in:Economy in Brief
Summary
Weak pricing power continues to stem from a shortfall in U. S. demand. The Bureau of Labor Statistics reported that the Consumer Price Index was unchanged last month after a 0.1% slip during March. More indicative of the weakness in [...]
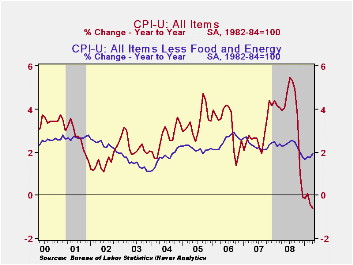
Weak pricing power continues to stem from a shortfall in U. S. demand. The Bureau of Labor Statistics reported that the Consumer Price Index was unchanged last month after a 0.1% slip during March. More indicative of the weakness in pricing power, the year-to-year change in consumer prices was -0.7%, the biggest since 1955. The April index was in accord with Consensus expectations for no change in the month.
The weakness in the recent CPI readings owes mostly to lower food and energy prices. In contrast, "core" pricing has picked up slightly. The CPI less food & energy rose 0.3% last month after three consecutive 0.2% increases. These gains lifted the twelve-month change to 1.9%, which was the firmest since January, and the growth rate here in 2009 has averaged 2.4% (AR). That four-month growth is up from a low of 0.5% as of December.
Lower energy prices again restrained overall pricing pressure
last month. The 2.4% decline in April reflected a 2.8% shortfall in
gasoline prices (-39.5% y/y) which added to a 4.0% March drop. Fuel oil
prices also continued downward with a 2.1% drop (-33.5% y/y). The
latest was the ninth consecutive monthly drop and it lowered prices by
one-third during the last twelve. Finally, prices for natural gas
& electricity have fallen in all but one of the last nine
months and year-to-year they are down 1.7%.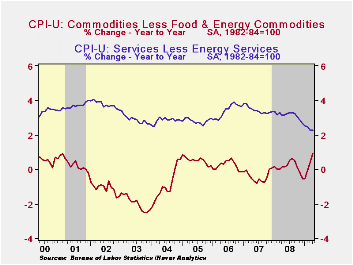
Lower food & beverage prices also continue to restrain overall inflationary pressure. Prices slipped for the third straight month and the y/y change of 3.3% was the weakest since early 2007, down from a peak of +6.1% last fall. Recent weakness has been led by lower dairy product prices (-5.1% y/y). Moreover, price gains for meats, poultry & fish (2.5% y/y) as well as fruits & vegetables (0.6% y/y) have eased sharply.
Bucking the disinflationary trend have been core
goods prices which rose 0.5% during April after three
consecutive 0.4% increases. Higher tobacco prices account continue to
account for some of that acceleration with a 28.8% y/y increase. But
there has been some modest firming of prices elsewhere. Prices for
household furnishings & operations have risen 1.8% y/y
following price deflation early last year. Apparel prices are up 0.9%
y/y after declines extending back to 1999. Prices of new & used
motor vehicles have risen during the last four months and the y/y
change of -1.7% compares to a rate of decline of 3.5% as of yearend
2008.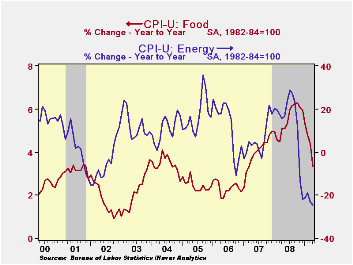
Gains in core services prices continue to moderate. The 0.2% uptick last month left the y/y change of 2.3% at its weakest since 1983. That moderation continues to owe mostly to weakness in the housing market which caused April shelter prices to rise just 0.2%, putting them up 1.6% y/y. That rise compares to gains above 4.0% two years ago. Owners equivalent rent of primary residence, a measure not equivalent to other house price measures, ticked up just 0.1% (2.1% y/y). The cost of travel did rise 0.5% during April but prices of lodging away from home are down 5.9% during the last year. Other service prices rose. The increase in medical care services prices picked up slightly to 0.4% (3.3% y/y) while education costs rose 0.4% and the y/y gain remained a firm 5.4%. Public transportation prices fell again. The 0.8% decline was the eighth drop in a row (-5.9% y/y).
The chained CPI, which adjusts for shifts in consumption patterns, gained 0.3% while year -to-year prices fell 1.1%. The increase in chained prices less food and energy eased to 0.2% in the month.
The consumer price data is available in Haver's USECON database while detailed figures can be found in the CPIDATA database.
Seeking Stability: What’s Next for Banking Regulation? from the Federal Reserve Bank of Dallas can be found here.
| Consumer Price Index (%) | April | March | Y/Y | 2008 | 2007 | 2006 |
|---|---|---|---|---|---|---|
| Total | 0.0 | -0.1 | -0.7 | 3.8 | 2.9 | 3.2 |
| Total less Food & Energy | 0.3 | 0.2 | 1.9 | 2.3 | 2.3 | 2.5 |
| Goods less Food & Energy | 0.5 | 0.4 | 0.9 | 0.1 | -0.4 | 0.2 |
| Services less Energy | 0.2 | 0.1 | 2.3 | 3.1 | 3.4 | 3.4 |
| Energy | -2.4 | -3.0 | -24.5 | 13.5 | 5.7 | 11.0 |
| Food & Beverages | -0.2 | -0.1 | 3.3 | 5.4 | 3.9 | 2.3 |
| Chained CPI: Total (NSA) | 0.3 | 0.2 | -1.1 | 3.3 | 2.5 | 2.9 |
| Total less Food & Energy | 0.2 | 0.4 | 1.4 | 2.0 | 2.0 | 2.2 |
by Robert Brusca May 15, 2009
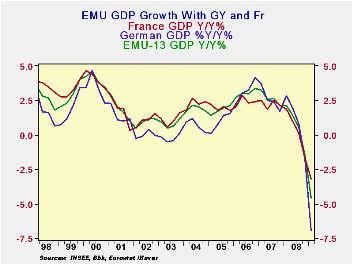
The EMU region’s sharp drop in GDP has turned out to be worse
than expected for the region as well as for most countries. Germany is
showing the deepest GDP drop since 1970. The drop that The Netherlands
is experiencing is the sharpest drop in GDP since the end of WWII.
Greece is the sole county in this table with positive growth yr/yr.
GDP continues to decelerate across Europe. We knew these GDP
reports would be weak after viewing the weakness in industrial output
ahead of the release of this GDP report. Germany’s Q1 decline is so
large it is not looking for much if any further decline in GDP for the
rest of the year.
The Swedish Finance Minister Anders Borg has said that Europe
may be in need of some further stimulus. Of course Europe also labors
under the constraint of the Maastricht rules that restrict fiscal
deficits and cap ratios of government debt to GDP. Not only does Europe
lack a central fiscal authority comparable to its central bank, but the
fragmented nature of fiscal responsibility makes it hard for Europe to
be involved in fiscal stimulus in a coordinated way. Instead of a
central fiscal authority the Maastricht rules stand in to restrict
individual nations from going overboard with fiscal policy actions that
could create too many government liabilities that might undermine the
value of the euro. Of course recessions naturally put pressure on
Maastricht rules since growth slows or declines, pushing tax revenues
down at a time that social safety new spending rises. Countries that
have room under the Maastricht ratios can engage in fiscal stimulus in
times like theses, but often it is the high debt countries that are in
greater need of the stimulus and must risk running afoul of the rules
if they act.
This down turn has exposed problems in the Euro Area. The Euro
Area is asymmetric. Its Central Bank has a mandate for price stability
only. Meanwhile there is no fiscal authority to step in when things get
tough. In this cycle the ECB actually joined in on an coordinated
international rate cut with its inflation rate well over ceiling on the
basis of a forecast that inflation would drop (of course the spot oil
price had dropped sharply and that was not a very risky forecast at the
time). Still it was an action that seemed to violate the rule if not
the spirit of having and inflation ceiling. Europe has not been able to
confront the problem that only the ECB can move fast in a crisis yet
its mandate is price stability.
After seeing these GDP reports markets did not react very
strongly. The weakness in GDP was expected. The degree of weakness has
turned out to be a bit worse than expected. It sill is not clear what
steps Europe will take next and if more fiscal stimulus will be part of
the approach or not.
| Euro Area and Main G-10 Country GDP Results | |||||||
|---|---|---|---|---|---|---|---|
| Quarter over quarter-SAAR | Year/Year | ||||||
| GDP | Q1-09 | Q4-08 | Q3-08 | Q1-09 | Q4-08 | Q3-08 | Q2-08 |
| EMU-15 | -9.6% | -6.3% | -1.0% | -4.6% | -1.5% | 0.6% | 1.4% |
| Austria | -8.5% | -2.6% | -1.3% | -4.6% | 0.3% | 1.8% | 2.3% |
| France | -4.7% | -5.7% | -0.7% | -3.2% | -1.7% | 0.1% | 1.0% |
| Germany | -14.4% | -8.6% | -2.1% | -6.9% | -1.8% | 0.8% | 2.0% |
| Greece | -4.6% | 1.2% | 1.5% | 0.3% | 2.4% | 2.7% | 3.4% |
| Italy | -9.4% | -8.3% | -3.2% | -5.9% | -3.0% | -1.3% | -0.3% |
| The Netherlands | -10.7% | -4.7% | -1.8% | -4.5% | -0.8% | 1.8% | 3.4% |
| Portugal | -5.9% | -6.2% | -0.8% | -3.0% | -1.8% | 0.4% | 0.6% |
| Spain | -7.0% | -3.8% | -1.2% | -2.9% | -0.7% | 0.9% | 1.8% |
| UK | -7.4% | -5.9% | -2.8% | -4.2% | -2.0% | 0.4% | 1.8% |
| US | -6.1% | -6.3% | -0.5% | -2.6% | -0.8% | 0.7% | 2.1% |
| Japan | #N/A | -12.1% | -1.4% | #N/A | -4.3% | -0.2% | 0.5% |
| Switzerland | #N/A | -1.2% | -0.3% | #N/A | -0.1% | 1.3% | 2.3% |
by Tom Moeller May 15, 2009
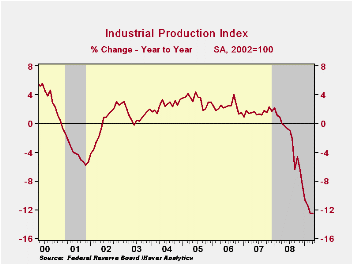
The severity of the downturn in industrial output eased last month, according to the industrial production figures published by the Federal Reserve. Output, which includes mining and utilities, declined an expected and moderate 0.5%, which was by far the smallest decline of this recession. The drop followed declines between one and four percent during the prior several months. Declines in the factory sector alone have eased as well. The 0.3% April shortfall was the smallest since February and compares to monthly declines between one and three percent during this recession.
Output of consumer goods overall was unchanged last month and
the year-to-date rate of decline eased to 7.3%. Last month, production
of autos actually increased, though it's down at a 44.4% rate this
year. Conversely, furniture output posted a 2.8% decline last month and
it's down at a 23.7% rate so far this year as consumers continue to shy
away from purchases of large durable goods. Apparel output fell 1.3%
and the three-month rate of -17.3% is half that of its worst. Even the
pace of the decline in the production of business equipment seems to
have eased with a 0.5% decline, though the three-month rate was near
its worst at -23.6%. The downturn in the housing market continued to
lower output of construction supplies. It fell 1.1% and the three-month
rate of decline eased to a "modest" 23.4%. 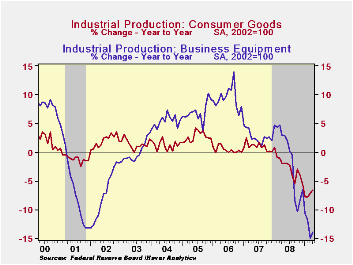
Even in the high-tech sector the rate of decline in output slowed. Here, industrial production fell 0.8% last month and at a reduced 13.5% rate during the last four. Less high tech, overall industrial production fell a reduced 0.4% last month and the annual rate of change eased to -15.3%.
O.K., so the slowing pace of output declines is largely in autos and the high-tech sector. But outside of these two sectors, output moderated to a 0.5% decline last month, less than one-third the March drop. The three-month rate of decline was still near its worst at a -13.4% annual rate.
Excess capacity grew even further last month. Capacity utilization fell to 69.1%, a record low for the series which dates to 1966. Utilization in the factory sector dropped even harder to 65.7% from a peak near 80% back in 2007. The latest rate was a record low since WW II.
The industrial production data are available in Haver's USECON database.
Ties that Bind: Bilateral Trade's Role in Synchronizing Business Cycles from the Federal Reserve Bank of Dallas is available here.
| INDUSTRIAL PRODUCTION (SA, %) | April | March | Y/Y | 2008 | 2007 | 2006 |
|---|---|---|---|---|---|---|
| Total Output | -0.5 | -1.7 | -12.5 | -2.2 | 1.5 | 2.3 |
| Manufacturing | -0.3 | -2.1 | -14.5 | -3.2 | 1.4 | 2.5 |
| Consumer Goods | 0.0 | -0.3 | -6.6 | -2.6 | 0.9 | 0.4 |
| Business Equipment | -0.5 | -2.9 | -13.9 | -1.1 | 2.7 | 9.4 |
| Construction Supplies | -1.1 | -2.8 | -20.0 | -6.3 | -2.0 | 2.3 |
| Utilities | 0.5 | 1.8 | -3.2 | 0.3 | 3.4 | -0.6 |
| Capacity Utilization | 69.1 | 69.4 | 79.2 (April '08) | 77.6 | 80.6 | 80.9 |

Tom Moeller
AuthorMore in Author Profile »Prior to joining Haver Analytics in 2000, Mr. Moeller worked as the Economist at Chancellor Capital Management from 1985 to 1999. There, he developed comprehensive economic forecasts and interpreted economic data for equity and fixed income portfolio managers. Also at Chancellor, Mr. Moeller worked as an equity analyst and was responsible for researching and rating companies in the economically sensitive automobile and housing industries for investment in Chancellor’s equity portfolio. Prior to joining Chancellor, Mr. Moeller was an Economist at Citibank from 1979 to 1984. He also analyzed pricing behavior in the metals industry for the Council on Wage and Price Stability in Washington, D.C. In 1999, Mr. Moeller received the award for most accurate forecast from the Forecasters' Club of New York. From 1990 to 1992 he was President of the New York Association for Business Economists. Mr. Moeller earned an M.B.A. in Finance from Fordham University, where he graduated in 1987. He holds a Bachelor of Arts in Economics from George Washington University.
More Economy in Brief


