 Global| Mar 14 2008
U.S. CPI Total & Core Unchanged
by:Tom Moeller
|in:Economy in Brief
Summary
The consumer price index (CPI-U) was unchanged in February following two consecutive months of 0.4% increase. It compared to expectations for a 0.3% rise and was the weakest since prices were unchanged last August. A slight dip in the [...]
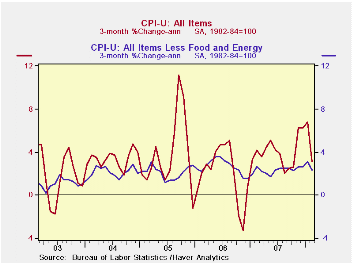
The consumer price index (CPI-U) was unchanged in February following two consecutive months of 0.4% increase. It compared to expectations for a 0.3% rise and was the weakest since prices were unchanged last August. A slight dip in the y/y rate of increase to 4.0% left it still at the second strongest growth rate since 2005.
Less food & energy, consumer prices also were unchanged m/m after January's elevated 0.3% increase. That also fell short of expectations for a 0.2% increase and it was the weakest reading since November 2006. The lack of an increase brought the y/y gain down to 2.3%, its lowest since last October. A Comparison of Measures of Core Inflation from the Federal Reserve Bank of New York can be found here.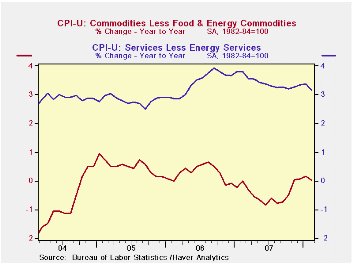
Inflation of food & beverage prices took a breather last month and dipped to 0.4% after a 0.7% January increase. It nevertheless left the y/y gain elevated at 4.6%, up from a 4.0% rate of increase last year. Prices for meats poultry & fish actually fell 0.1% m/m (4.7% y/y) after a 0.8% January pop and prices for fruits & vegetables also fell by 1.3% (+1.4% y/y) after the 2.2% rise during January. Cereal & bakery product prices, however, surged 1.8%. The y/y increase here of 6.6% was the strongest since 1990.
Energy prices prices also were tame last month and posted a 0.5% decline. The drop owed to a 2.0% m/m decline in gasoline prices but that still left them up 32.7% from twelve months earlier. Moreover, the weekly data for this month already indicate that the respite from price strength has ended. A 5.5% m/m rise in average gasoline prices so far in March to $3.23 per gallon would be the strongest since November. Also, it will add by itself 0.3% to the March CPI increase. Prices for fuel oil & other fuels in February backed off 1.3% (+33.0% y/y) after a strong 3.7% January surge. Natural gas & electricity prices, however, worked the other way and rose 1.7% (3.5% y/y).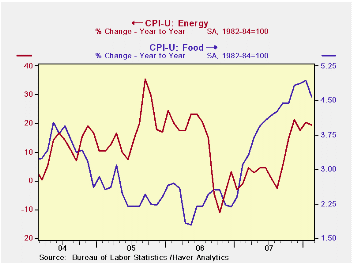
Core goods prices in February dipped 0.1%, the first m/m decline since last June. It reflected a 0.3% decline (-1.0% y/y) in apparel prices and no change (-0.6% y/y) in household furnishings & operations (-0.6% y/y). Prices for new & used motor vehicles also fell by 0.2% (0.0% y/y) during February.
Core services price inflation also took a breather in February and eased to 0.1%. Shelter prices, which constitute 33% of the total CPI, were unchanged (2.9% y/y). Owners equivalent rent of primary residence, a measure not equivalent to other house price measures, ticked up 0.1% (2.6% y/y). Medical care services prices also rose just 0.1% after a 0.6% January surge. Prices were up a strong 5.0% y/y after last year's 5.3% increase. Tuition costs rose 0.3% (5.5% y/y), about equal to the strong 5.6% gain during all of last year. Public transportation prices dipped 0.1% (+5.2% y/y).
Stable Prices, Stable Economy: Keeping Inflation in Check Must be No. 1 Goal of Monetary Policymakers from the Federal Reserve bank of St. Louis is available here.A Falling Dollar Raises Inflation in the Gulf also from the Federal Reserve Bank of St. Louis can be found here.
| Consumer Price Index (%) | February | January | December | Feb. Y/Y | 2007 | 2006 | 2005 |
|---|---|---|---|---|---|---|---|
| Total | 0.0 | 0.4 | 0.4 | 4.0 | 2.9 | 3.2 | 3.4 |
| Total less Food & Energy | 0.0 | 0.3 | 0.2 | 2.3 | 2.3 | 2.5 | 2.2 |
| Goods less Food & Energy | -0.1 | 0.2 | 0.0 | 0.0 | -0.4 | 0.2 | 0.5 |
| Services less Energy | 0.1 | 0.4 | 0.3 | 3.2 | 3.4 | 3.4 | 2.8 |
| Energy | -0.5 | 0.7 | 1.7 | 18.9 | 5.6 | 11.0 | 17.0 |
| Food & Beverages | 0.4 | 0.7 | 0.1 | 4.6 | 4.0 | 2.3 | 2.5 |
| Chained CPI: Total (NSA) | 0.3 | 0.5 | -0.1 | 3.7 | 2.5 | 2.9 | 2.9 |
| Total less Food & Energy | 0.3 | 0.3 | -0.1 | 2.0 | 2.0 | 2.2 | 1.9 |

Tom Moeller
AuthorMore in Author Profile »Prior to joining Haver Analytics in 2000, Mr. Moeller worked as the Economist at Chancellor Capital Management from 1985 to 1999. There, he developed comprehensive economic forecasts and interpreted economic data for equity and fixed income portfolio managers. Also at Chancellor, Mr. Moeller worked as an equity analyst and was responsible for researching and rating companies in the economically sensitive automobile and housing industries for investment in Chancellor’s equity portfolio. Prior to joining Chancellor, Mr. Moeller was an Economist at Citibank from 1979 to 1984. He also analyzed pricing behavior in the metals industry for the Council on Wage and Price Stability in Washington, D.C. In 1999, Mr. Moeller received the award for most accurate forecast from the Forecasters' Club of New York. From 1990 to 1992 he was President of the New York Association for Business Economists. Mr. Moeller earned an M.B.A. in Finance from Fordham University, where he graduated in 1987. He holds a Bachelor of Arts in Economics from George Washington University.
More Economy in Brief


