 Global| Dec 14 2007
U.S. CPI Total & Core Slightly Above Expectations
by:Tom Moeller
|in:Economy in Brief
Summary
The consumer price index (CPI-U) rose 0.8% last month due to the surge in energy prices. The gain was the quickest since September of 2005, a month when higher energy prices similarly raised the index.A 0.6% rise in the November CPI [...]
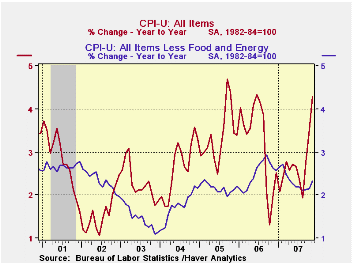
The consumer price index (CPI-U) rose 0.8% last month due to the surge in energy prices. The gain was the quickest since September of 2005, a month when higher energy prices similarly raised the index.A 0.6% rise in the November CPI had been expected by a Consensus of economists. The y/y gain in prices of 4.3% was its quickest since June of last year.
Core consumer price inflation picked up slightly to 0.3% after five months of 0.2% increase. A 0.2% gain was the general expectation. The y/y increase of 2.3% was its quickest in six months and the three month rise, to 2.6% (AR), has shown acceleration this year.
Energy prices soared 5.7%, the fastest
rise since a 5.9% increase during March of this year. Those two gains
were the quickest since an 11.8% surge in 2005. That was subsequently
followed by m/m declines and/or more moderate gains in energy prices.
Gasoline prices jumped 9.3% (37.1% y/y) last month but the weekly data
already indicate a slight m/m decline in December. Prices for fuel oil
& other fuels surged 11.9% (28.4% y/y) but natural gas
& electricity prices rose just 0.7% (4.4% y/y). 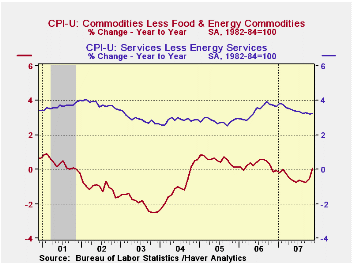
Food & beverage prices rose 0.3% (4.7% y/y) but that was enough to lift the y/y increase to its fastest since 1991. Prices of dairy products were notably strong and rose 0.6% (14.0% y/y). Prices for fruits & vegetable jumped 1.6% (4.5% y/y) but prices for meats, poultry & fish fell 0.1% (5.4% y/y).
Core goods prices rose 0.2% after slight declines during each of the prior three months. Apparel prices surged 0.8% (-0.4% y/y) after having been unchanged in October. New & used motor vehicle prices were unchanged (-0.4% y/y) after two months of decline. Prices of household furnishings & operation rose a slight 0.1% (-0.7% y/y) after four straight months of decline.Tobacco prices increased 0.2% (8.2% y/y) for the second month but the y/y gain was its strongest since early 2003. The core CPI less tobacco rose 0.3% (2.3%).
Core services prices rose 0.3% (3.2% y/y). Shelter prices increased 0.3% (3.1% y/y) and that y/y change was its slowest since early this year. Owners equivalent rent of primary residence, a measure not equivalent to other house price measures, rose 0.3%, reducing the y/y gain to 2.8% y/y. Since a low several months ago of 1.8%, the three month change has picked up to 3.4%, its firmest since January. Public transportation prices rose 1.8% (6.1% y/y) and medical care services prices rose 0.3% (5.8% y/y). Education service prices rose 0.6% (5.5% y/y) after a firm 0.7% October gain but communication prices fell (-0.1% y/y) for the second consecutive month.
The chained CPI, which adjusts for shifts in the mix of consumer purchases rose 0.4% (3.6% y/y) but the core measure was unchanged. This latter measure is similar to the core PCE price index but its treatment of housing price differs
A Comparison of Measures of Core Inflation from the Federal Reserve Bank of New York can be found here.
| Consumer Price Index | November | October | September | Y/Y | 2006 | 2005 | 2004 |
|---|---|---|---|---|---|---|---|
| Total | 0.8% | 0.3% | 0.3% | 4.3% | 3.2% | 3.4% | 2.7% |
| Total less Food & Energy | 0.3% | 0.2% | 0.2% | 2.3% | 2.5% | 2.2% | 1.8% |
| Goods less Food & Energy | 0.2% | -0.0% | -0.0% | 0.0% | 0.2% | 0.5% | -0.9% |
| Services less Energy | 0.3% | 0.2% | 0.3% | 3.2% | 3.4% | 2.8% | 2.8% |
| Energy | 5.7% | 1.4% | 0.3% | 21.3% | 11.1% | 16.9% | 10.8% |
| Food & Beverages | 0.3% | 0.3% | 0.5% | 4.8% | 2.3% | 2.4% | 3.4% |
| Chained CPI: Total (NSA) | 0.4% | 0.2% | 0.3% | 3.6% | 2.8% | 2.9% | 2.5% |
| Total less Food & Energy | 0.0% | 0.3% | 0.3% | 2.0% | 2.3% | 1.9% | 1.7% |
by Tom Moeller December 14 2007
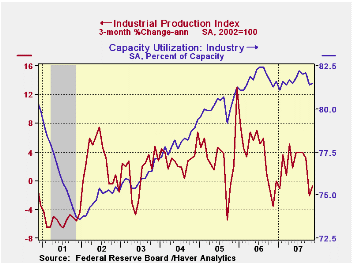
Industrial production rose 0.3% last month but the increase recovered less than half of the downwardly revised 0.7% drop in October. The Consensus expectation had been for a 0.2% rise.
Factory output also recovered from an October drop that was revised deeper. The 0.4% November increase left the three month change in output at -0.3%.
Output gains were broad based. Production in the motor vehicle & parts industries rose 1.6% and recovered all of the prior month's 1.5% drop. However that still left output down 1.6% from a year earlier. Output of furniture & related products bounced 0.4% (-2.0% y/y) following two months of sharp decline and output of construction supplies was unchanged (1.0% y/y).
Also in the consumer goods sector, production of computers
& electronics rose 1.5% (+13.4% y/y). Output of apparel was
unchanged (-3.8% y/y) but output of chemical products was down for the
fourth straight month (-0.5% y/y).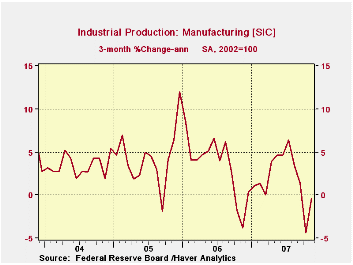
Output of business equipment rose a solid 1.0% (4.0% y/y). Output of information & processing equipment surged 2.3% (9.3% y/y). Three month growth amounted to 11.9% (AR). Production of industrial equipment inched up 0.2% after a 0.9% October shortfall. Three month growth recovered to 2.7% (AR), well below the 6.7% growth of last year.
In the materials category output rose 0.5% and recovered all of the prior month's decline. Production of durable consumer parts rose 0.9% (5.0 y/y). Production of durable equipment parts surged 1.4% (7.4% y/y) but consumer durable parts output only rose 0.5% (-0.5% y/y) after three months of sharp decline.
Capacity utilization inched up to 81.5% from a revised 81.4% in October. Utilization in the factory sector also rose slightly m/m to 79.8% and averaged 80.2% last year. Capacity rose 0.1% (1.8% y/y).
The Macroeconomics of Oil Shocks from the Federal Reserve Bank of Philadelphia can be found here.
| INDUSTRIAL PRODUCTION (SA) | November | October | Y/Y | 2006 | 2005 | 2004 |
|---|---|---|---|---|---|---|
| Total | 0.3% | -0.7% | 2.2% | 4.0% | 3.2% | 2.5% |
| Manufacturing | 0.4% | -0.7% | 2.3% | 5.0% | 4.0% | 3.0% |
| Mining | 1.2% | -0.7% | 2.2% | 2.7% | -1.6% | -0.6% |
| Utilities | -1.4% | -1.4% | 1.2% | 0.2% | 2.0% | 1.4% |
by Robert Brusca December 14, 2007
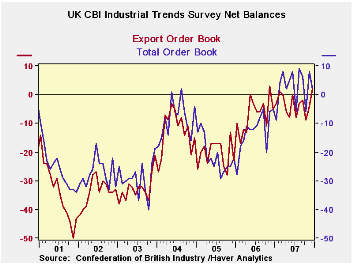
The CBI Industrial Survey shows still firm readings for
measures of activity. Orders are still in the 86th percentile of their
range. Export orders remain in the 98th percentile of their range.
Output volume is much softer in the 55th percentile of its range.
Stocks are a bit above mid range as well in their 57th percentile,
roughly balanced with the position of sales. Average prices expected
remain elevated with a +15 reading, down from +21 in November but still
in the 82nd percentile of their range.
Orders are surprisingly resilient especially for exports a
surprise given the buoyancy of the pound sterling and given the slowing
signals we have seen for the Euro area, to say nothing of slowing in
the US. But output volume has sunken well below its 12-month average of
+15 to stand at +3. There is some disconnect between orders and output
trends. Clearly one aspect is that the overseas economies are holding
up better than is the UK economy. Meanwhile, the average inflation
reading over 12 months is +17 and that is only a touch stronger than
the +15 reading for December that lingers as current output readings
have softened.
| UK Industrial Volume Data CBI Survey | |||||||||
|---|---|---|---|---|---|---|---|---|---|
| Reported: | Dec-07 | Nov-07 | Oct-07 | Sep-07 | 12MO Avg | Pcntle | Max | Min | Range |
| Total Orders | 2 | 8 | -6 | 6 | 3 | 86% | 9 | -40 | 49 |
| Export Orders | 2 | -4 | -9 | -2 | -3 | 98% | 3 | -50 | 53 |
| Stocks: Finished Goods | 14 | 14 | 14 | 7 | 10 | 57% | 26 | -2 | 28 |
| Output Volume: Next 3-Mo | 3 | 9 | 10 | 17 | 15 | 55% | 28 | -28 | 56 |
| Avg Prices 4Nxt 3m | 15 | 21 | 14 | 16 | 17 | 82% | 25 | -30 | 55 |
| From end 2000 | |||||||||
by Robert Brusca December 14, 2007
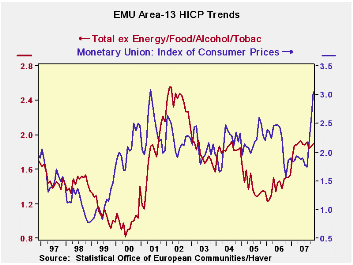
The inflation trends tell the story. It’s a clear story of
angst at the ECB. The sequential growth rates (3Mo Vs 6Mo Vs 12Mo) show
a steady quickening of the pace of inflation in the more recent time
periods. Over 12 months (ECB’s preferred horizon) three of our four key
EMU countries show ex food ex energy and ex alcohol inflation at a pace
above the ECB ceiling. Over the more recent periods that situation has
only gotten worse. As to headline inflation: forget about it. The
history on the graph on the let shows that once headline inflation
spurts the core rise usually follows in a year or so. The year 2005 was
an exception when the core fell by itself. There is nothing automatic
about headline-> core inflation transmission. But there is
enough correlation to make the ECB’s fears of second or third round
effects real. On top of that the current core pace is simply
unacceptable.
If the multi-central bank dollar credit facility is
‘successful’ it could hasten the time when the ECB hikes rates. Whether
that widens interest differentials with the US depends on whether US
circumstances normalize and whether such normalization brings with it a
rebalancing of the economy (where consumer confidence is sagging so
badly and in a way that it does not appear to be wholly determined by
credit market issues).
While the credit turmoil, crisis, scam or whatever you may
want to call it, is a real and essentially global phenomenon, it is not
the only concern in town. And that applies to the evolution of European
growth as well as in the US. In Europe arguably much of the outlook
hangs in the balance on what the euro does from here on out. What
inflation does and how the ECB responds to it will be a large par of
that.
| Trends in HICP | |||||||
|---|---|---|---|---|---|---|---|
| % mo/mo | % saar | ||||||
| Nov-07 | Oct-07 | Sep-07 | 3-Mo | 6-Mo | 12-Mo | Yr Ago | |
| EMU-13 | 0.7% | 0.4% | 0.4% | 6.1% | 3.7% | 3.1% | 1.9% |
| Core | 0.3% | 0.3% | 0.2% | 3.4% | 2.5% | 2.3% | 1.6% |
| Goods | 1.0% | 0.8% | 1.0% | 11.8% | 3.7% | 3.4% | 1.7% |
| Services | -0.1% | 0.0% | -0.5% | -2.4% | 1.2% | 2.5% | 2.1% |
| HICP | |||||||
| Germany | 0.9% | 0.2% | 0.7% | 7.1% | 4.1% | 3.3% | 1.5% |
| France | 0.8% | 0.2% | 0.1% | 4.6% | 3.4% | 2.6% | 1.6% |
| Italy | 0.3% | 0.7% | 0.3% | 5.1% | 3.3% | 2.5% | 2.1% |
| Spain | 0.8% | 0.7% | 0.4% | 7.4% | 4.7% | 4.1% | 2.7% |
| Core Excl Food Energy & Alcohol | |||||||
| Germany | 0.4% | 0.2% | 0.3% | 3.5% | 2.5% | 2.4% | 1.1% |
| France | 0.3% | 0.2% | 0.1% | 2.6% | 2.3% | 1.9% | 1.4% |
| Italy | 0.2% | 0.5% | 0.4% | 4.3% | 2.7% | 2.2% | 1.8% |
| Spain | 0.3% | 0.7% | 0.2% | 4.9% | 3.9% | 3.3% | 2.7% |

Tom Moeller
AuthorMore in Author Profile »Prior to joining Haver Analytics in 2000, Mr. Moeller worked as the Economist at Chancellor Capital Management from 1985 to 1999. There, he developed comprehensive economic forecasts and interpreted economic data for equity and fixed income portfolio managers. Also at Chancellor, Mr. Moeller worked as an equity analyst and was responsible for researching and rating companies in the economically sensitive automobile and housing industries for investment in Chancellor’s equity portfolio. Prior to joining Chancellor, Mr. Moeller was an Economist at Citibank from 1979 to 1984. He also analyzed pricing behavior in the metals industry for the Council on Wage and Price Stability in Washington, D.C. In 1999, Mr. Moeller received the award for most accurate forecast from the Forecasters' Club of New York. From 1990 to 1992 he was President of the New York Association for Business Economists. Mr. Moeller earned an M.B.A. in Finance from Fordham University, where he graduated in 1987. He holds a Bachelor of Arts in Economics from George Washington University.
More Economy in Brief


