 Global| Oct 17 2007
U.S. CPI Gain Quickest Since May, Core Rate 0f 0.2% Stable
by:Tom Moeller
|in:Economy in Brief
Summary
The consumer price index (CPI-U) rose 0.3% last month and that was the quickest since May. At 2.8%, the y/y rise also picked up and was the fastest since March. The September increase was slightly ahead of expectations for a 0.2% [...]
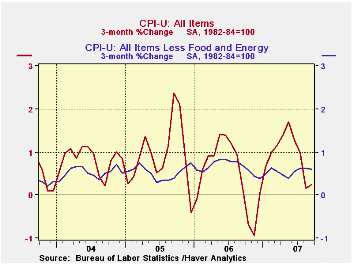
The consumer price index (CPI-U) rose 0.3% last month and that was the quickest since May. At 2.8%, the y/y rise also picked up and was the fastest since March. The September increase was slightly ahead of expectations for a 0.2% gain.
Food & beverage prices continued with a pattern of steadily increasing rates of change with a 0.5% (4.4% y/y) rise. That y/y increase is double the rate of last December. Prices for meats, poultry & fish firmed by 0.5% (5.5% y/y) and prices of dairy product prices jumped another 1.0% with the y/y gain a whopping 13.2%.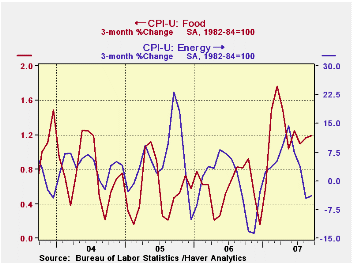
Energy prices were somewhat tame last month, rising just 0.3%, but gasoline prices (+8.7% y/y y/y) rose slightly for the first month in the last four. Fuel oil prices jumped 1.0% (6.5% y/y) but natural gas & electricity prices rose 0.1% (1.4% y/y) after five consecutive months of decline.
Core consumer price inflation held stable at 0.2% for the fifth month in the last six and the y/y increase held stable with August at 2.1%.
Core goods prices fell just slightly as they did in August. Apparel prices again reversed direction and rose 0.3% (-1.7% y/y) after a 0.5% August decline and a 0.4% July increase. New & Used motor vehicle prices were under pressure and fell 0.2% (-1.3% y/y) while prices of household furnishings & operation fell for the third straight month by 0.2% (-0.7% y/y).Tobacco prices again provided much of the lift to goods price inflation with an accelerated 0.8% (7.5% y/y) rise.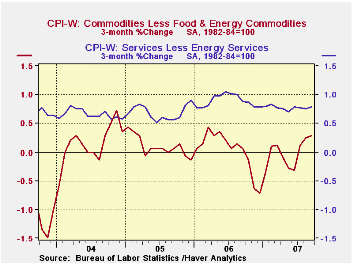
Minutes of the Federal Reserve Board Discount Rate Meetings, August 16 through September 18, 2007 are available here.
| Consumer Price Index | Sept | Aug | July | Y/Y | 2006 | 2005 | 2004 |
|---|---|---|---|---|---|---|---|
| Total | 0.3% | -0.1% | 0.1% | 2.8% | 3.2% | 3.4% | 2.7% |
| Total less Food & Energy | 0.2% | 0.2% | 0.2% | 2.2% | 2.5% | 2.2% | 1.8% |
| Goods less Food & Energy | -0.0% | -0.0% | 0.1% | -0.8% | 0.2% | 0.5% | -0.9% |
| Services less Energy | 0.3% | 0.2% | 0.3% | 3.3% | 3.4% | 2.8% | 2.8% |
| Energy | 0.3% | -3.2% | -1.0% | 5.4% | 11.1% | 16.9% | 10.8% |
| Food & Beverages | 0.5% | 0.4% | 0.3% | 4.4% | 2.3% | 2.4% | 3.4% |
| Chained CPI: Total (NSA) | 0.3% | -0.1% | -0.1% | 2.3% | 2.8% | 2.9% | 2.5% |
| Total less Food & Energy | 0.3% | 0.2% | 0.0% | 1.7% | 2.3% | 1.9% | 1.7% |
by Tom Moeller October 17, 2007
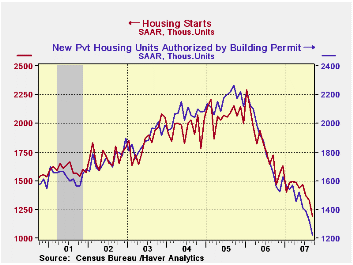
With a 10.2% m/m decline last month, housing starts at 1.191M units fell to the lowest level since 1992. Consensus expectations had been for a lesser drop to 1.29M starts. The August figure was little revised.
Single-family starts fell hard for the sixth straight month. At 963M units single family also fell to their lowest since 1992 with a 1.7% fall.
In September, the decline in single family starts was led by an 11.5% (-28.0 y/y) drop in the Midwest. In the West single family starts fell 1.4% (-32.2% y/y) and in the South the m/m decline was limited to 0.2% (-32.4% y/y). Single family starts in the Northeast actually posted a rise of 9.6% (-20.0% y/y) but that is no sign of stabilization as the level was still one third below the the 3Q average.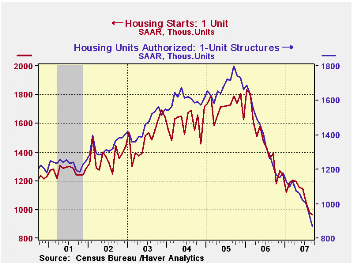
Starts of multi-family structures fell by one third, month to month to the lowest level since 1994.
Building permits also were weak and fell 7.3% (-25.9% y/y) with single-family permits off a similar 7.1% (-28.6% y/y).
A Tale of Two Crisis from the Federal Reserve Board of St. Louis is available here.
| Housing Starts (000s, AR) | Sept | Aug | July | Y/Y | 2006 | 2005 | 2004 |
|---|---|---|---|---|---|---|---|
| Total | 1,191 | 1,327 | 1,371 | -30.8% | 1,812 | 2,073 | 1,950 |
| Single-Family | 963 | 980 | 1,058 | -30.8% | 1,474 | 1,719 | 1,604 |
| Multi-Family | 228 | 347 | 313 | -30.9% | 338 | 354 | 345 |
| Building Permits | 1,226 | 1,322 | 1,389 | -25.9% | 1,842 | 2,159 | 2,058 |
by Robert Brusca October 17, 2007
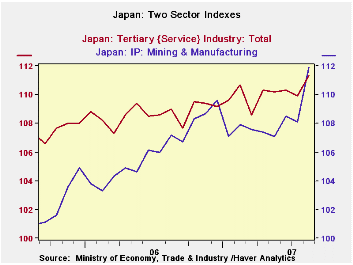
Japan’s economic signals took a turn for the better in August as the sector indexes for manufacturing and mining as well as for the services sector (the tertiary index) advanced strongly in August. Each of these sectors show the highest readings in their respective ranges since February 1993. The manufacturing and mining index is on a strong surge. The tertiary index is slower but steadily gaining trend.These readings come as the IMF in its twice-yearly World Economic Outlook (WEO) warned the BOJ not to hike rates too soon. Japan’s recent economic readings have been erratic. Its price trends have not completely set the event of deflation behind it. So while these sector readings are good news they do not yet make the needed clear case for solid growth in Japan.
| Recent Months | Moving Averages | Extremes; Range | |||||||
| Aug-2007 | Jul-2007 | Jun-2007 | 3-Mo | 6-Mo | 12-Mo | Max | Min | %-Tile | |
| Mining and MFG | 111.9 | 108.1 | 108.5 | 109.5 | 108.4 | 108.2 | 111.9 | 87.7 | 100.0% |
| Tertiary | 111.3 | 109.9 | 110.3 | 110.5 | 110.1 | 109.7 | 111.3 | 91.0 | 100.0% |
| Ranges, Max, Min since 1993 | |||||||||
by Carol Stone October 17, 2007
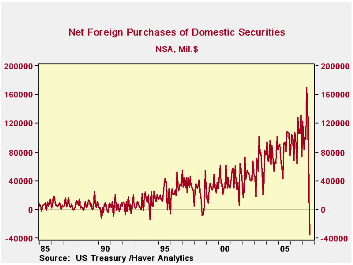
News stories have already highlighted the substantial liquidation of US securities by foreign investors that is portrayed in the monthly Treasury International Capital System (TIC) data for August. As reported yesterday, investors from outside the US were net sellers of $34.9 billion worth of US long-term securities during the financial market chaos that plagued much of that month. By type, they sold equities most, $40.6 billion, and also Treasuries, $2.6 billion, and corporates, $1.2 billion; they bought $9.6 billion in Agency notes and bonds. Several aspects of this and other segments of the Treasury's TIC release are worthy of note.
First, we, as others, must comment on the dramatic change these figures show from the record net purchases in May. Then, foreign investors scooped up $170.1 billion in US securities, including sizable purchases of all four categories, especially equities at $42.0 billion and corporate bonds at $78.3 billion. Obviously the environment was different then.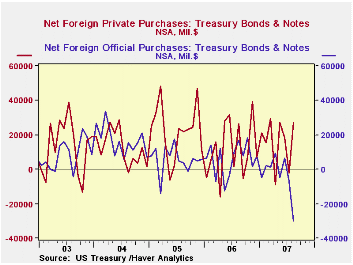
Second, the behavior of private and official foreign investors differed considerably from each other in August. While each group has its own investment objectives, we are impressed with how this led them to act then. The net sales of Treasury securities were concentrated at foreign official institutions, at $29.7 billion. In almost a mirror image, private investors abroad were net purchasers of $27.3 billion. We'd attribute the private purchases to the risk-aversion that became so important during the month, favoring the least risky assets, but that can't quite explain the net sales by central banks and governmental accounts elsewhere. A puzzle, like much of financial market activity in that period.
Third, there were also dramatic differences among countries. Investors in the UK remained net purchasers of total US securities, to the tune of $31.7 billion; as ever, this reflects the "clearinghouse" nature of the London markets, crisscrossing trades from around the world. Among other countries, the Chinese were net sellers, as might be expected, but "just" $10.1 billion. International parties in the offshore market centers of Bermuda and the Cayman Islands were also sizable sellers, as were the Japanese.
Fourth, through it all, Americans continued to buy foreign securities. See in the table, there was even a mild pickup in August relative to the previous couple of months.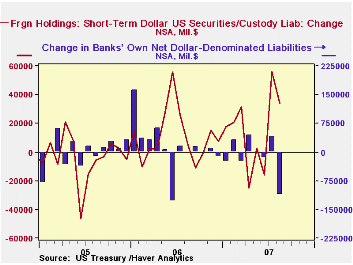
Fifth, besides long-term securities, of course, foreigners can certainly also invest in short-term securities. The TIC data system doesn't emphasize this, perhaps because those investments are, by definition, short-term. The recently revised format of the TIC press release does give this information. Sure enough, August – and even more in July – saw net purchases of short-term instruments, $33.9 billion in August and $56.2 billion in July. These compare with an average of $11.3 billion monthly during 2006 and net disinvestment of $4.0 billion in 2005. Private investors moved into Treasury bills in August while selling other short-term items.
Finally, the Treasury also reports monthly data on banks' net dollar-denominated liabilities. These had a net reduction of $111.4 billion in August, a swing from an increase of $40.9 billion in July. We point this out to grab still another opportunity to repeat our own mantra about capital flows and the nation's current account. The differential pattern of all these assets movements compared to each other and to prior months should indicate that a variety of motives influence funds flows in world markets and among world institutions. During August, foreign investors were net sellers of US long-term securities, but so were US investors. Private foreign investors and US investors ran to Treasuries, both long-term and Treasury bills. There is no specific aspect of any of these flows that relates to financing of US trade activity. There is lots of it that relates to the financing of US housing markets and corporate activities. Those had been attractive investment sectors for everyone; they are less so now, regardless of where investors are domiciled.
| Net Foreign Purchases from US Residents, Bil $ | August 2007 | July 2007 |
June 2007 |
May 2007 |
Monthly Averages
|||
|---|---|---|---|---|---|---|---|
| Last 12 Months | 2006 | 2005 | |||||
| "Headline": Net Foreign Purchases = 1 + 2 + Other* |
-85.5 | -2.7 | 84.4 | 117.2 | 49.5 | 62.0 | 58.0 |
| 1. Domestic Securities | -34.9 | 25.0 | 121.7 | 170.1 | 92.1 | 97.2 | 84.3 |
| Treasuries | -2.6 | -9.4 | 24.7 | 22.7 | 15.3 | 17.3 | 28.2 |
| Agencies | 9.6 | 8.7 | 35.6 | 27.0 | 22.3 | 24.5 | 18.3 |
| Corporate Bonds | -1.2 | 4.5 | 28.5 | 78.3 | 41.0 | 42.8 | 31.0 |
| Equities | -40.6 | 21.2 | 28.8 | 42.0 | 13.4 | 12.6 | 6.8 |
| 2. Foreign Securities | -34.5 | -5.5 | -21.8 | -37.6 | -26.6 | -21.0 | -14.4 |
| 3. Short-Term Sec's & Custody Holdings | 33.9 | 56.2 | -16.0 | 2.5 | 11.1 | 11.3 | -4.0 |
| 4. Banks' Liabilities | -111.4 | 40.9 | -15.4 | -3.6 | -4.7 | 15.4 | 1.4 |
| Total TIC Flows** | -163.0 | 94.3 | 53.1 | 116.0 | 55.9 | 88.6 | 55.4 |
| China | -10.1 | 4.5 | 21.2 | 11.1 | 10.0 | 9.7 | 7.4 |
| United Kingdom | 31.7 | 25.1 | 55.4 | 65.5 | 35.7 | 26.5 | 26.4 |
| Cayman Islands | -14.7 | -16.4 | 9.6 | 1.0 | 7.3 | 12.1 | 4.1 |

Tom Moeller
AuthorMore in Author Profile »Prior to joining Haver Analytics in 2000, Mr. Moeller worked as the Economist at Chancellor Capital Management from 1985 to 1999. There, he developed comprehensive economic forecasts and interpreted economic data for equity and fixed income portfolio managers. Also at Chancellor, Mr. Moeller worked as an equity analyst and was responsible for researching and rating companies in the economically sensitive automobile and housing industries for investment in Chancellor’s equity portfolio. Prior to joining Chancellor, Mr. Moeller was an Economist at Citibank from 1979 to 1984. He also analyzed pricing behavior in the metals industry for the Council on Wage and Price Stability in Washington, D.C. In 1999, Mr. Moeller received the award for most accurate forecast from the Forecasters' Club of New York. From 1990 to 1992 he was President of the New York Association for Business Economists. Mr. Moeller earned an M.B.A. in Finance from Fordham University, where he graduated in 1987. He holds a Bachelor of Arts in Economics from George Washington University.
More Economy in Brief


