 Global| Mar 19 2009
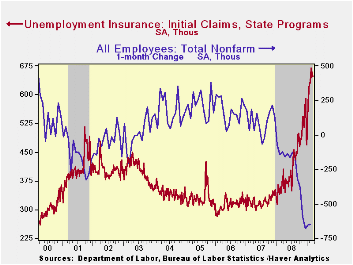
U.S. Continuing Claims for Unemployment Insurance Touch New Record; Initial Claims Dip
by:Tom Moeller
|in:Economy in Brief
Summary
It is the largest drop in e-Zone IP since records have been kept. Intermediate goods, capital goods and consumer goods output trends are being clobbered. Each sector is worsening sequentially. Each of the countries displayed: Germany, [...]
It is the largest drop in e-Zone IP since records have been
kept. Intermediate goods, capital goods and consumer goods output
trends are being clobbered. Each sector is worsening sequentially. Each
of the countries displayed: Germany, France, Italy, and the UK, is
experiencing sequentially worsening rates of growth for their selected
measures of IP.
It is getting worse. The EU is in the belly of the beast and
beast is recession.
Statements for Germany today confirm that things are getting
worse there and that there are no signs of a turnaround. In France
INSEE is now looking for Q1-2009 to be weaker than Q4-2008. In France
despite the lobbying Sarkozy has done for more stimulus and relaxation
within the Zone, French workers are striking as if he could DO
SOMETHING about the severity of the recession. They are in fact wanting
him to do more to mitigate it. But France, like other EMU members, has
to be mindful of the Maastricht rules that apply to budget deficits.
Europeans, despite seeing this worsening in their respective economies,
are amazingly blasé about doing more to mitigate the effects. Moreover,
within the Group of 20 European member are far more interested in rules
and regulations for the future than in dealing with current issues. If
they were firemen they’d be calling in the arson investigators instead
of dousing the still-raging and expanding flames. Europeans are
different.
| Unemployment Insurance (000s) | 03/14/09 | 03/07/09 | 02/28/09 | Y/Y | 2008 | 2007 | 2006 |
|---|---|---|---|---|---|---|---|
| Initial Claims | 646 | 658 | 645 | 72.3% | 420 | 321 | 313 |
| Continuing Claims | -- | 5,473 | 5,288 | 91.0% | 3,342 | 2,552 | 2,459 |
by Robert Brusca March 19, 2009
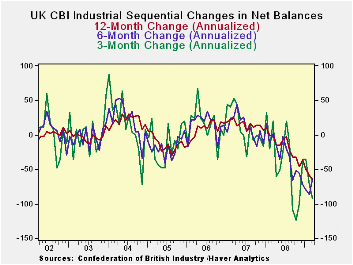
The UK CBI survey for industry shows a new low at -58. Exports
also are on a new low despite the weakness in sterling that should aid
competitiveness.
New orders slipped to -58 in March from -56 in February. The
outlook index continues to slide. At -48 it is on a new low as well.
The outlook for the volume of output three-months ahead has slipped by
6 points since November while orders have slipped much more, by 20
points. Still both readings are on at their lows since 2000.
The six month changes (declines) seem to have slowed down for
as orders are dropping at a slower pace. The three-month change in
orders has been cycling and is well off it lows. Only the Yr/Yr measure
of declines continues to move relentlessly lower, indicating deeper
declines. All of this is consistent with the notion that the UK is
going to leave the most severe part of its downturn behind it. It is
not yet certain, but the data are consistent with such a transition in
the phase of the UK cycle.
| UK Industrial volume data CBI Survey | ||||||||||
|---|---|---|---|---|---|---|---|---|---|---|
| Reported: | Mar 09 |
Feb 09 |
Jan 09 |
Dec 08 |
Nov 08 |
12MO Avg | Pcntle | Max | Min | Range |
| Total Orders | -58 | -56 | -48 | -35 | -38 | -20 | 0% | 9 | -56 | 65 |
| Export Orders | -51 | -49 | -39 | -33 | -31 | -18 | 0% | 3 | -49 | 52 |
| Stocks: FinGds | 31 | 27 | 27 | 21 | 25 | 18 | 100% | 27 | -2 | 29 |
| Looking ahead | ||||||||||
| Output Volume :Nxt 3M | -48 | -44 | -43 | -42 | -42 | -16 | 0% | 28 | -44 | 72 |
| Avg Prices 4Nxt 3m | -13 | -12 | 0 | 0 | 10 | 18 | 13% | 34 | -19 | 53 |
| From end 2000 | ||||||||||
by Tom Moeller March 19, 2009
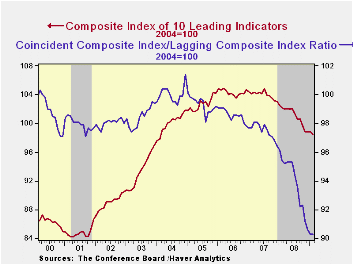
The Conference Board reported that the February composite index of leading economic indicators fell 0.4% to a new low for this cycle. The decline followed a 0.1% January increase that was downwardly revised.
Six of the ten components of the leading index rose last month
including a sharp steepening of the yield curve, but these gains were
offset by materially higher claims for unemployment insurance, shorter
hours worked, lower stock prices and reduced consumer expectations.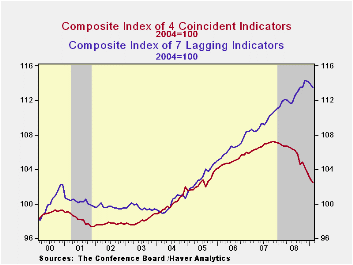
The breadth of one-month increase amongst the leaders' 10 components improved to 60% but over a six-month period the breadth of gain amongst the components fell to just 20%.
The leading index is based on actual reports for eight economic data series. The Conference Board initially estimates two series, orders for consumer goods and orders for capital goods.
Continuing to reflect economic recession, the coincident indicators dropped a sharp 0.4% and they are off 4.0% during the last year. Half of the four component series fell with outsized declines registered by employment and production. Over the last ten years there has been a 76% correlation between this y/y change and real GDP.
The lagging index fell 0.4% after a 0.3% January decline. The ratio of coincident-to-lagging indicators (a measure of economic excess) was stable at its lowest level since 1975.
The Conference Board figures are available in Haver's BCI database. Visit the Conference Board's site for coverage of leading indicator series from around the world.
Risk management in the banking industry is yesterday's U.S. Senate testimony of Roger T. Cole, Director, Division of Banking Supervision and Regulation, U.S. Federal Reserve. It can be found here.
| Business Cycle Indicators (%) | February | January | December | Nov. 6-Month % (AR) | 2008 | 2007 | 2006 |
|---|---|---|---|---|---|---|---|
| Leading | -0.4 | 0.1 | -0.1 | -4.1 | -2.8 | -0.3 | 1.5 |
| Coincident | -0.4 | -0.6 | -0.7 | -6.1 | -0.8 | 1.6 | 2.5 |
| Lagging | -0.4 | -0.3 | -0.1 | 0.9 | 2.9 | 2.8 | 3.3 |
by Tom Moeller March 19, 2009
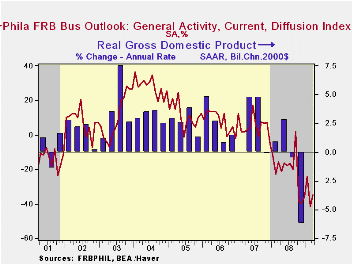
The latest figures from the Philadelphia Federal Reserve Bank indicate that economic contraction continued. During March, the Index of General Business conditions in the manufacturing sector came in at -35.0 versus a reading of -41.3 last month. Expectations were for -39. The latest was near the lowest since 1991.
During the last ten years there has been a 70% correlation between the level of the Philadelphia Fed Business Conditions Index and the three-month growth in factory sector industrial production. There has been a 64% correlation with q/q growth in real GDP.
The Philadelphia Fed constructs a diffusion index for total
business activity and each of the sub-indexes. The business conditions
index reflects a separate survey question.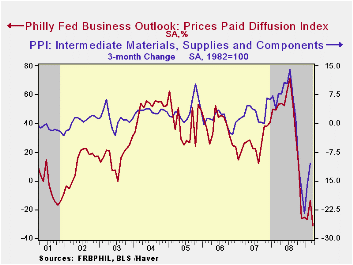
Amongst the sub-indexes, the employment index fell out of bed. The 6.2 point decline pulled the index to another record low. Fifty-two percent of respondents expected to reduce employment levels, another record, while none expected to raise them. During the last ten years there has been a 79% correlation between the index level and the m/m change in manufacturing sector payrolls.
The new orders figure again was quite weak and deteriorated to the lowest level since 1980. The shipments index improved from its record low, but the move was slight.
The prices paid index at -31.3 was near the record low. Five percent of respondents planned to raise prices while thirty seven percent expected to lower them. During the last ten years there has been a 73% correlation between the prices paid index and the three-month growth in the intermediate goods PPI. There has been an 82% correlation with the change in core intermediate goods prices.
The separate index of expected business conditions in six months fell slightly but remained near its highest level since September. The expectations index for new orders fell back to the lowest level since December but the expectations index for employment held steady at a slightly improved reading versus the lows this past fall.
The figures from the Philadelphia Federal Reserve can be found in Haver's SURVEYS database.
The latest Business Outlook Survey from the Federal Reserve Bank of Philadelphia can be found here.
The Peopling of Macroeconomics: Microeconomics of Aggregate Consumer Expenditures from the Federal Reserve Bank of Philadelphia is available here.
| Philadelphia Fed (%) | March | February | March '08 | 2008 | 2007 | 2006 |
|---|---|---|---|---|---|---|
| General Activity Index | -35.0 | -41.3 | -15.9 | -21.3 | 5.0 | 8.0 |
| Prices Paid Index | -31.3 | -13.7 | 53.4 | 36.4 | 26.3 | 36.7 |

Tom Moeller
AuthorMore in Author Profile »Prior to joining Haver Analytics in 2000, Mr. Moeller worked as the Economist at Chancellor Capital Management from 1985 to 1999. There, he developed comprehensive economic forecasts and interpreted economic data for equity and fixed income portfolio managers. Also at Chancellor, Mr. Moeller worked as an equity analyst and was responsible for researching and rating companies in the economically sensitive automobile and housing industries for investment in Chancellor’s equity portfolio. Prior to joining Chancellor, Mr. Moeller was an Economist at Citibank from 1979 to 1984. He also analyzed pricing behavior in the metals industry for the Council on Wage and Price Stability in Washington, D.C. In 1999, Mr. Moeller received the award for most accurate forecast from the Forecasters' Club of New York. From 1990 to 1992 he was President of the New York Association for Business Economists. Mr. Moeller earned an M.B.A. in Finance from Fordham University, where he graduated in 1987. He holds a Bachelor of Arts in Economics from George Washington University.
More Economy in Brief


