 Global| Jun 19 2009
U.S. Consumers' Quest For Value
by:Tom Moeller
|in:Economy in Brief
Summary
New figures available in Haver's SURVEYS database point up how chain store sales have been influenced this year by sales at Wal-Mart. The International Council of Shopping Centers (ICSC) along with Goldman Sachs produce monthly chain [...]
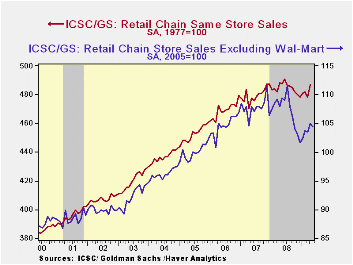
New figures available in Haver's SURVEYS database point up how chain store sales have been influenced this year by sales at Wal-Mart. The International Council of Shopping Centers (ICSC) along with Goldman Sachs produce monthly chain store sales figures with and without this big, value-priced retailer. Both data sets paint a picture of recovery in consumer spending; however, sales minus Wal-Mart have been less vibrant. Estimates suggest that Wal-Mart boosted sales growth by four percentage points or more during the depths of the recession. Before this recession began, the sales gains were more comparable to one another -- except in the 2001 recession, when a differential also opened up.
Wal-Mart does not currently report monthly sales along with the other retailers; instead, it reports just quarterly. Therefore, the monthly figures must be interpolated as they are by ICSC and are available only with a lag. These numbers show that from June to December, sales without Wal-Mart fell 6.8% but with Wal-Mart they were down a lesser 2.5%. The quest for value was acute. Now that consumer spending seems to be recovering from last year's slump, bargain hunting has become less intense. Sales excluding the retail giant rose 3.2% from January through April while sales with Wal-Mart rose a comparable 1.8%. Sales without Wal-Mart during May slipped 0.5% and Wal-Mart's sales will be available shortly.
The lesson clearly is that value matters a lot when times get
tough. What sales patterns might we continue to see into the recovery?
The historical evidence shows that the inroads made by Wal-Mart may be
sustained, but that the growth differentials between sales with or
without this big retailer will narrow. During the whole year following
the recession of 2001, for instance, overall chain store sales rose by
2.3%, but without Wal-Mart they increased 1.8%.It will be useful to
continue to watch both series for the fullest perspective of consumers'
spending patterns.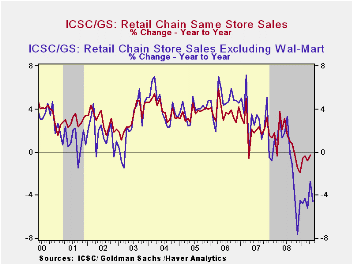
Regardless of which chain store sales series is observed, consumer spending currently is under pressure. Gains in store sales are just moderate versus last year. Furniture & appliance store sales are lower though apparel store sales have risen slightly. The consumer spending prospects do, however, look brighter. Consumer confidence and consumer sentiment have been rising this year along with after-tax incomes due to recent tax cuts. Moreover, weakness in pricing power has enabled real after-tax incomes to grow this year at a 6.3% annual rate following their measly 1.3% gain during 2008. Even the job market has improved marginally as first time claims for unemployment insurance have fallen.
The chain store figures sighted above are comparable-store, or same-store, sales figures. As such they are similar to the weekly chain store sales values reported by ICSC/Goldman Sachs. These are available in Haver's SURVEYW database.
From 1996, this article from the Federal Reserve Bank of New York concludes that chain store sales can significantly improve the accuracy of predictions for several measures of consumer spending. It can be found here.
Oil prices and consumer spending from the Federal Reserve Bank of Richmond is available here.
| ICSC/Goldman Sachs Chain Store Sales (SA, 1977=100) | May | Y/Y | April | Y/Y | March | Y/Y | 2008 | 2007 | 2006 |
|---|---|---|---|---|---|---|---|---|---|
| Total | -- | -- | 486.9 | -0.3% | 478.0 | -0.8% | 1.0% | 2.3% | 3.7% |
| Excluding Wal-Mart | 104.4 | -4.6% | 104.9 | -2.8% | 103.5 | -5.2% | -0.6% | 3.0% | 4.7% |
by Tom Moeller June 19, 2009
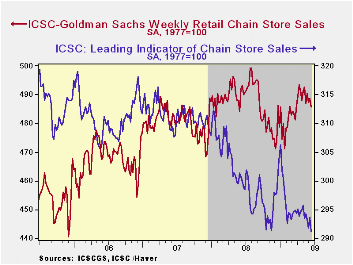
Commentary has been offered regularly on Haver.com about weekly chain store sales. That begs the question of how these figures differ from the monthly? The answer is that the weekly figures are based on a survey of sales taken by ICSC-Goldman Sachs while the monthly figures are based on reports directly from the retailers. And the tallies can differ. After the weekly figures are aggregated, during the last ten years there has been a not-perfect 73% correlation between the y/y change in the two series. Moreover, on a three-month basis that correlation shrinks to 14%. The one-month correlation is even smaller.
What the weekly figures indicate is that sales have lost their upward momentum. Weekly store sales declined in the latest period for the third week in the last five. The 0.6% decline lowered sales so far in June 0.5% below the May average after that month's 0.2% slip. Since the October '08 low, however, sales remained up by 2.3%. We'll have to wait and see whether these figures foreshadow a similar trend in the monthly report.
During the last ten years there has been a 69% correlation between the year-to-year growth in chain store sales and the growth in general merchandise sales. The weekly figures are available in Haver's SURVEYW database.
The ICSC-Goldman Sachs retail chain-store sales index is constructed using the same-store sales (stores open for one year) reported by 78 stores of seven retailers: Dayton Hudson, Federated, Kmart, May, J.C. Penney, Sears and Wal-Mart.
Prospects for spending also seemed less than promising last week. Last week, the leading indicator of sales reversed all of the prior period's rise with a 0.7% decline. The decline lowered the indicator 0.4% from May and by 2.9% y/y.
| ICSC-UBS (SA, 1977=100) | 06/12/09 | 06/05/09 | Y/Y | 2008 | 2007 | 2006 |
|---|---|---|---|---|---|---|
| Total Weekly Chain Store Sales | 485.6 | 488.6 | -1.5% | 1.4% | 2.8% | 3.3% |
by Robert Brusca June 19, 2009
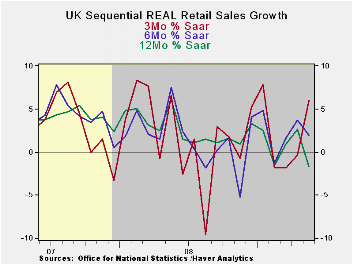
UK retail sales fell unexpectedly in May and, combined with
news of greater public sector borrowing, markets sold off with
particular pressure on the pound sterling. The UK has been posting some
of the best economic numbers in Europe but with the slippage in retail
sales some of that optimism has faded. Still there are upbeat signs in
the UK economy.
One sign of optimism is still retail sales themselves.
Although the Yr/Yr figures are worsening the six months trends have
barely turned lower and three-month trends are sill quite strong and
advancing. Perhaps the disappointment is more about markets getting
ahead of themselves than about any real disappointment in retail sales
trends themselves.
The UK housing market is showing some signs of stirring.
Mortgage lending still fell in the recent month (May) but lenders
suspect that demand for purchases has been increasing. It is mostly
re-mortgaging activity that has been slackening off. It is reported
that for every home for sale there are four who are looking to buy
according to a survey by the U.K.'s National Association of Estate
Agents on Thursday. There are still signs of an upswing in the UK.
The CBI industrial trend survey is still very weak but its
index moved up to -51 from -56 in May as well.
On balance the reaction to retail sales may prove to be
excessively pessimistic since improving trends still seem to the rule,
not the exception, in the UK.
| UK Real and Nominal Retail Sales | ||||||||
|---|---|---|---|---|---|---|---|---|
| Nominal | May-09 | Apr-09 | Mar-09 | 3-Mo | 6-Mo | 12-Mo | Yr Ago | Quarter 2-date |
| Retail Total | -0.3% | 0.6% | 1.2% | 6.3% | 2.4% | -1.1% | 6.4% | 4.5% |
| Food Bev & Tobacco | 0.6% | 0.2% | 0.8% | 6.6% | 4.8% | 3.8% | 8.3% | 7.6% |
| Clothing footwear | -2.3% | -1.0% | 1.3% | -7.9% | 1.7% | -8.5% | 8.5% | -9.3% |
| Real | ||||||||
| Retail Ex Auto | -0.7% | 1.0% | 1.2% | 6.0% | 2.0% | -1.7% | 6.1% | 3.2% |

Tom Moeller
AuthorMore in Author Profile »Prior to joining Haver Analytics in 2000, Mr. Moeller worked as the Economist at Chancellor Capital Management from 1985 to 1999. There, he developed comprehensive economic forecasts and interpreted economic data for equity and fixed income portfolio managers. Also at Chancellor, Mr. Moeller worked as an equity analyst and was responsible for researching and rating companies in the economically sensitive automobile and housing industries for investment in Chancellor’s equity portfolio. Prior to joining Chancellor, Mr. Moeller was an Economist at Citibank from 1979 to 1984. He also analyzed pricing behavior in the metals industry for the Council on Wage and Price Stability in Washington, D.C. In 1999, Mr. Moeller received the award for most accurate forecast from the Forecasters' Club of New York. From 1990 to 1992 he was President of the New York Association for Business Economists. Mr. Moeller earned an M.B.A. in Finance from Fordham University, where he graduated in 1987. He holds a Bachelor of Arts in Economics from George Washington University.
More Economy in Brief


