 Global| Dec 09 2005
U.S. Consumer Sentiment Stronger Than Expected
by:Tom Moeller
|in:Economy in Brief
Summary
Consumer sentiment in early December rose more than generally expected, reported the University of Michigan. The 8.7% m/m rise to 88.7 added to a 10.0% rise in November and beat Consensus expectations for an increase to 85.0. During [...]
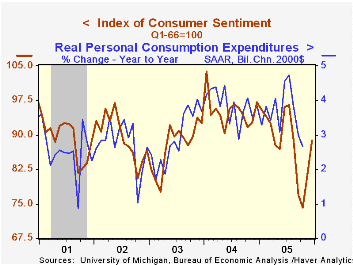
Consumer sentiment in early December rose more than generally expected, reported the University of Michigan. The 8.7% m/m rise to 88.7 added to a 10.0% rise in November and beat Consensus expectations for an increase to 85.0.
During the last ten years there has been a 76% correlation between the level of consumer sentiment and the y/y change in real consumer spending.
Consumers' expectations again improved sharply and the index rose 11.1% on top of a 10.1% November gain. Expected business conditions during the next year rose sharply for the third straight month though the level remained down 21.3% versus last year. Expectations for personal finances also rose sharply m/m but here again the index level remained lower than last year by 3.1%. The mean expected inflation rate for the next twelve months held steady m/m at 4.2% though that was below the 5.5% expected in October & September.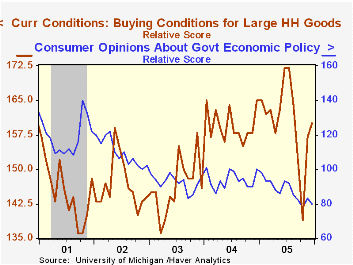
The current conditions index added 6.4% to the 9.9% November gain but remained well depressed versus last year. The reading of personal finances surged 12.6% (+3.6% y/y) and the reading of buying conditions for large household goods added to November's 12.9% jump ((-3.0% y/y).Weighing on sentiment is consumers' reading of gov't economic policy (-20.0% y/y).
The University of Michigan survey is not seasonally adjusted.The mid-month survey is based on telephone interviews with 250 households nationwide on personal finances and business and buying conditions. The survey is expanded to a total of 500 interviews at month end.
Why Hasn't the Jump in Oil Prices Led to a Recession? from the Federal Reserve Bank of San Francisco is available here.
| University of Michigan | Dec (Prelim.) | Nov | Y/Y | 2004 | 2003 | 2002 |
|---|---|---|---|---|---|---|
| Consumer Sentiment | 88.7 | 81.6 | -8.7% | 95.2 | 87.6 | 89.6 |
| Current Conditions | 106.6 | 100.2 | -0.1% | 105.6 | 97.2 | 97.5 |
| Expectations | 77.3 | 69.6 | -15.0% | 88.5 | 81.4 | 84.6 |
by Carol Stone December 9, 2005
Foreign trade developments are always interesting in the UK, since it is involved in so many different kinds of activities: manufacturing, shipping, insurance and oil, to name a few. In October, the balance on goods and services decreased by £1 billion to £2.9 billion as exports rose and imports fell from September amounts. The balance on fuel returned to a near neutral position after reaching unprecedented deficits in August and September. The balance on services was steady, reestablishing its old trend after a plunge in August due to Hurricane Katrina.
Among exports, manufactured goods maintained a firm trend for a third month, breaking a prior wide seesaw pattern. The value of crude oil exports surpassed £2 billion for the first time, ironically even as oil prices actually fell slightly from September; the volume of crude shipped surged more than 33% after sagging in August and September.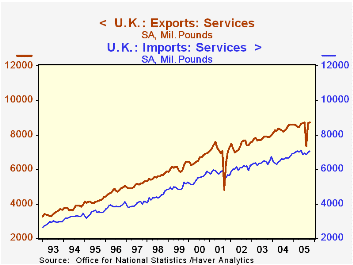
On the import side, widespread decreases in manufactured goods contributed to a £681 million decline in total goods imports. Vehicles were down £158 million and other finished goods £256 million, the latter a second successive decrease that basically offset a jump in August. Oil imports also fell, with both a volume decrease and a slight drop in the unit value.
Insurance payments figured heavily in an earlier swing in the trade balance. According to the ONS, Lloyds of London paid out an estimated £1.4 billion in benefits for Hurricane Katrina losses. The last time such a large negative flow (a negative export of services provided by a UK entity, not to be confused with an import of services, which would be provided by a foreign entity) occurred was in September 2001, and that was considerably more, at about £2.3 billion. Both of these were one-time payments, so the broad service export total quickly reversed to its then-current amounts. The overall balance on services had thus been a mere £457 million in August, but rebounded quickly to £1.7 billion in September and was basically unchanged in October.
| United Kingdom: Trade SA, Bil.£ |
Oct 2005 | Sept 2005 | Aug 2005 | Oct 2004 | Monthly Averages|||
|---|---|---|---|---|---|---|---|
| 2004 | 2003 | 2002 | |||||
| Trade Balance: Goods & Services | -2.88 | -3.90 | -5.49 | -3.78 | -3.26 | -2.58 | -2.63 |
| Exports | 27.24 | 26.82 | 25.14 | 24.68 | 24.26 | 23.52 | 22.91 |
| Imports | 30.12 | 30.72 | 30.63 | 28.46 | 27.52 | 26.10 | 25.54 |
| Goods | -4.55 | -5.60 | -5.95 | -5.66 | -5.04 | -3.99 | -3.92 |
| Fuels | -0.08 | -0.75 | -0.59 | -0.00 | 0.10 | 0.42 | 0.53 |
| Exports | 2.27 | 1.94 | 1.65 | 1.60 | 1.50 | 1.38 | 1.33 |
| Imports | 2.35 | 2.67 | 2.24 | 1.59 | 1.40 | 0.96 | 0.80 |
| Services | 1.67 | 1.70 | 0.46 | 1.87 | 1.77 | 1.41 | 1.30 |
by Tom Moeller December 9, 2005
Recent strength in commodity prices highlight the fear that inflation is about to surge. However the concern is based not just on the gains in metals prices, for example, but on a broader array of potentially inflationary indications.1) Real economic growth amongst OECD countries has doubled to (a still moderate) 2.5% versus 2001 and growth elsewhere in the world is blistering. Chinese economic growth at 14% is up from 4% in 1999 and growth in India has nearly doubled to 8% from a 2001 low of 4.5%.
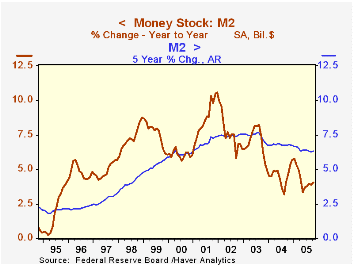
2) Though US money growth recently has declined, the five year growth rate of 6.3% is triple the growth of ten years ago. Relationships between money and inflation are not what they used to be, but financial liquidity will always be viewed as integral to the equation. The issue is examined by the Federal Reserve Bank of St. Louis in Monetary Instrument Matters.
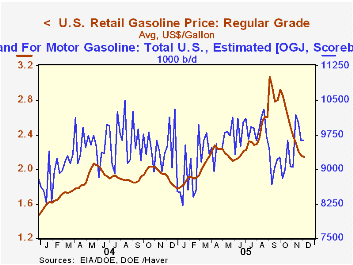
3) Energy prices remain elevated. Oil prices are more than 20% higher than last year's average which rose 53% from 2003 and the cold weather that has gripped much of the US has recently pushed prices up further. Most notable has been the spike in natural gas prices which yesterday were over $14/mmbtu, a rough doubling of last year's level. Crude oil prices also rose over $60/bbl. for West Texas Intermediate for the first time in a month. That rise along with a rebound in the demand for gasoline promises an end to the recent fall in retail gasoline prices. (Gasoline has a 3.9% weight in the Consumer Price Index, electricity has a 2.4% weight and natural gas' weight is 1.3%.).
For the latest Short Term Energy Outlook from the US Department of Energy click here.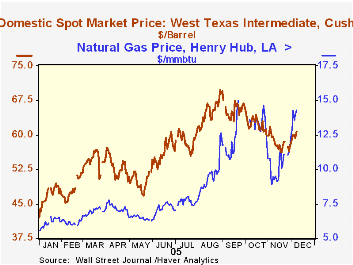
 4) Gold prices recently surged over $500 per ounce and into territory not plotted since 1981. During the last twenty years there has been a fairly high 52% correlation between the level of gold and the expected rate of inflation during the next year. Most of that correlation, however, seems to reflect current pricing power. Gold's correlation with next year's growth in the CPI has been negligible. The late Jude Wanniski's thoughts on the Gold Standard can be found here and the Federal Reserve Bank of Cleveland's 1998 research simply titled Gold Prices can be found here.
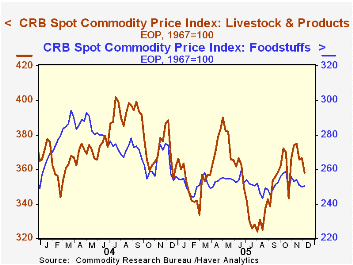
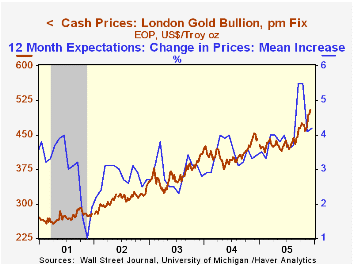 5) The latest jump in industrial commodity prices for many is the prima fascia indication of a pending inflation pickup, but the gain seems more to reflect better economic growth. In fact industrial commodity prices have had roughly a 50% correlation with the y/y change in factory sector output during the last ten years and only a 15% correlation with the change in core goods prices in the CPI. Though even here, individual performance has been mixed. Metals prices have recovered all of the early-year drop and on average are nearly double the 2001 low, the strength paced by a near four fold rise in copper prices during the last four years. Textile prices, however, are up just 10% over four years. Further obfuscation of the issue is provided by the strong 47% correlation between industrial materials prices and the change in the overall CPI.6) An inflationary threat from rising food prices depends on how much meat is part of the diet since livestock & meat prices have rebounded strongly from the mid-year lows. That misses a near 60% price rise since 2002 which has been paced 40-50% gains in beef prices, 60% higher broiler prices and 50%+ gains in pork prices. Grain price increases have been relatively tame but even coffee prices are double the 2003 level. The latest Food Price Outlook from the USDA Food Institute can be found here.
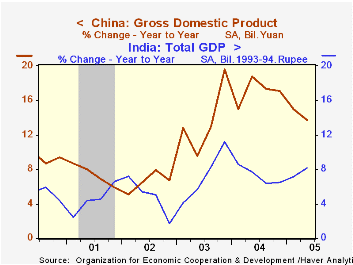
| Commodity Prices | 12/02/05 | 12/31/04 | Y/Y | 2004 | 2003 | 2002 |
|---|---|---|---|---|---|---|
| JoC-ECRI All Industrials | 116.52 | 111.55 | 2.8% | 22.6% | 15.6% | -1.0% |
| Textiles | 67.70 | 64.35 | 5.1% | 1.1% | 9.0% | -2.6% |
| Metals | 127.20 | 124.55 | -0.2% | 39.7% | 12.5% | -0.4% |
| Miscellaneous | 103.44 | 103.85 | 2.7% | 10.8% | 19.9% | -1.7% |
| Petroleum Products | 267.70 | 216.50 | 6.6% | 53.1% | 22.9% | 1.1% |
| CRB Spot Commodity Foodstuffs | 250.22 | 255.77 | -8.6% | 2.7% | 4.6% | 16.8% |
| CRB Spot Commodity Livestock & Products | 358.00 | 362.63 | -7.8% | -0.7% | 14.9% | 23.9% |
| Gold (Handy & Harmon, /Troy Oz.) | $504.25 | $443.40 | 11.6% | 6.5% | 20.7% | 23.7% |
| US Retail Gasoline, Regular ($/Gal.) | $2.19 | $1.79 | 12.6% | $1.85 | $1.56 | $1.35 |
| Domestic Spot Market Price: West Texas Intermediate ($/Barrel) | $52.04 | $41.78 | 33.7% | $41.78 | $32.78 | $31.23 |

Tom Moeller
AuthorMore in Author Profile »Prior to joining Haver Analytics in 2000, Mr. Moeller worked as the Economist at Chancellor Capital Management from 1985 to 1999. There, he developed comprehensive economic forecasts and interpreted economic data for equity and fixed income portfolio managers. Also at Chancellor, Mr. Moeller worked as an equity analyst and was responsible for researching and rating companies in the economically sensitive automobile and housing industries for investment in Chancellor’s equity portfolio. Prior to joining Chancellor, Mr. Moeller was an Economist at Citibank from 1979 to 1984. He also analyzed pricing behavior in the metals industry for the Council on Wage and Price Stability in Washington, D.C. In 1999, Mr. Moeller received the award for most accurate forecast from the Forecasters' Club of New York. From 1990 to 1992 he was President of the New York Association for Business Economists. Mr. Moeller earned an M.B.A. in Finance from Fordham University, where he graduated in 1987. He holds a Bachelor of Arts in Economics from George Washington University.
More Economy in Brief


