 Global| Nov 14 2003
U.S. Consumer Sentiment Firm
by:Tom Moeller
|in:Economy in Brief
Summary
The University of Michigans consumer sentiment index rose more than expected in mid-November to 93.5 versus 89.6 in October. It was the highest sentiment reading since May 2002. Consensus expectations were for a reading of 91.0. [...]
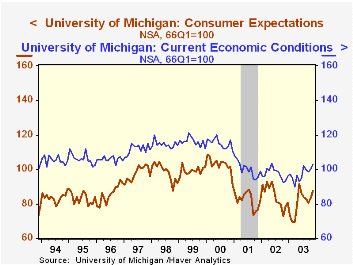
The University of Michigan’s consumer sentiment index rose more than expected in mid-November to 93.5 versus 89.6 in October. It was the highest sentiment reading since May 2002. Consensus expectations were for a reading of 91.0.
During the last ten years there has been a 70% correlation between the level of consumer sentiment and the y/y change in real PCE.
The current conditions index rose to 102.8, again the highest level since May 2002.
The expectations index rose to 87.6, the highest level since May of this year.
The University of Michigan survey is not seasonally adjusted.It is based on telephone interviews with 250 households nationwide on personal finances and business and buying conditions. The survey is expanded to a total of 500 interviews at month end.
| University of Michigan | Mid-Nov | Oct | Y/Y | 2002 | 2001 | 2000 |
|---|---|---|---|---|---|---|
| Consumer Sentiment | 93.5 | 89.6 | 11.0% | 89.6 | 89.2 | 107.6 |
| Current Conditions | 102.8 | 99.9 | 10.4% | 97.5 | 100.1 | 115.2 |
| Consumer Expectations | 87.6 | 83.0 | 11.6% | 84.6 | 82.3 | 102.7 |
by Tom Moeller November 14, 2003
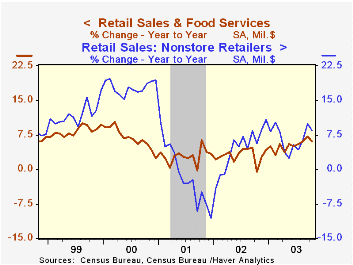
Retail sales fell 0.3% last month but the 0.2% decline in September was deepened to 0.4%. Consensus expectations were for no change. Excluding motor vehicles & parts dealers sales rose 0.2% last month. The September gain was revised to 0.2% from 0.3%. Consensus expectations were for a 0.3% rise in October.
Motor vehicle dealers' sales fell 1.9% m/m in October. Unit sales of light vehicles fell 6.5% m/m to 15.6 mil. (AR). Sales at gasoline service stations fell 1.6% (4.6% y/y).
Sales at food services & drinking places jumped 1.9% (10.6% y/y). Less this strength, nonauto retail sales fell slightly last month (5.6% y/y).
Apparel and accessory stores ticked 0.1% higher (4.6% y/y) following a downwardly revised 0.9% September gain. Furniture, home furnishing and electronics store sales rose 0.5% (9.4% y/y) but September now shows a 0.7% increase versus the initial report of a slight decline. Furniture and computer sales have been quite strong. Sales at general merchandise stores were unchanged m/m (4.6% y/y).
Sales of building materials surged again, up 1.6% (12.5% y/y).
Sales of nonstore retailers rose 0.7% (8.6% y/y)
| Oct | Sept | Y/Y | 2002 | 2001 | 2000 | |
|---|---|---|---|---|---|---|
| Retail Sales & Food Services | -0.3% | -0.4% | 6.1% | 3.1% | 2.9% | 6.7% |
| Excluding Autos | 0.2% | 0.2% | 6.2% | 3.6% | 2.9% | 7.4% |
by Tom Moeller November 14, 2003
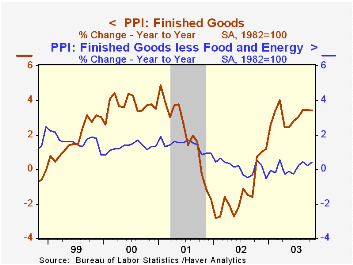
Finished producer prices rose quite a bit more than expected last month, up 0.8% versus Consensus expectations for a 0.2% gain. Core producer prices also were strong rising 0.4% versus expectations for a 0.1% uptick.
Core finished consumer goods prices jumped 0.6% (0.1% y/y) as passenger car prices surged 7.0% (-0.4% y/y). Tobacco prices (0.5%) and carpet prices (0.8%) also were strong.
Capital equipment prices rose 0.6% (0.9% y/y). The gain was largely confined to higher prices for light trucks (1.7% y/y).
Finished energy prices fell 0.1% (9.3% y/y) following a 0.1% gain in September. The decline was due to lower prices for gasoline (3.7% y/y) and residential natural gas (24.9% y/y) which offset a surge in fuel oil prices (3.2% y/y). These energy product price series are NSA.
Intermediate goods prices rose 0.4% reflecting strength in prices for certain chemicals, plywood (36.6% y/y) and metals.
Crude goods prices jumped 2.6% and again were strong due to gains in scrap metals prices.
| Producer Price Index | Oct | Sept | Y/Y | 2002 | 2001 | 2000 |
|---|---|---|---|---|---|---|
| Finished Goods | 0.8% | 0.3% | 3.4% | -1.3% | 2.0% | 3.7% |
| Core | 0.5% | 0.0% | 0.4% | 0.1% | 1.4% | 1.3% |
| Intermediate Goods | 0.4% | -0.1% | 3.5% | -1.5% | 0.4% | 4.9% |
| Core | 0.3% | 0.1% | 1.8% | -0.5% | -0.1% | 2.6% |
| Crude Goods | 2.6% | 3.4% | 22.7% | -10.6% | 0.3% | 22.8% |
| Core | 3.1% | 2.3% | 14.1% | 3.8% | -10.0% | 7.4% |
by Tom Moeller November 14, 2003
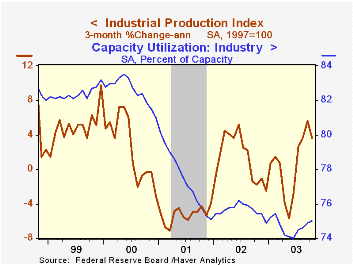
Industrial production rose 0.3% in October, as expected by the Consensus of economists. Increases in output in earlier months were revised slightly upward. Slight data revisions extend back to 1972.
Output in the manufacturing sector rose just 0.1% (0.7% y/y). The 0.7% September gain in output was unrevised but earlier months were revised stronger.
Output in selected high-technology industries jumped 2.5% (20.5% y/y). Output of computers and peripheral equipment surged 1.4% (13.1% y/y) and output of semiconductors & related equipment rose 3.5% (30.5% y/y). Output of communications equipment rose 1.4% (9.7% y/y) and upward revisions to prior months were quite large.
"Taking the Pulse of the Tech Sector: A Coincident Index of High-Tech Activity" from the Federal Reserve Bank of New York can be found here.
Excluding high-tech, factory output fell 0.1% (-0.6% y/y) as output of motor vehicles & parts (2.4% y/y) gave back roughly half of the September jump. Electrical equipment & appliance output rose 0.7% (0.3% Y/Y). Output in earlier months was revised up. Furniture output rose 0.4% (-2.1% y/y) and output of non-durable goods fell slightly (-2.0% y/y).
Total capacity utilization rose slightly to 75.0% and capacity growth improved slightly to 1.2% from earlier figures showing 1.1% y/y growth.
| Production & Capacity | Oct | Sept | Y/Y | 2002 | 2001 | 2000 |
|---|---|---|---|---|---|---|
| Industrial Production | 0.3% | 0.5% | 0.7% | -0.6% | -3.4% | 4.4% |
| Capacity Utilization | 75.0% | 74.9% | 75.4%(10/02) | 75.6% | 77.4% | 82.6% |

Tom Moeller
AuthorMore in Author Profile »Prior to joining Haver Analytics in 2000, Mr. Moeller worked as the Economist at Chancellor Capital Management from 1985 to 1999. There, he developed comprehensive economic forecasts and interpreted economic data for equity and fixed income portfolio managers. Also at Chancellor, Mr. Moeller worked as an equity analyst and was responsible for researching and rating companies in the economically sensitive automobile and housing industries for investment in Chancellor’s equity portfolio. Prior to joining Chancellor, Mr. Moeller was an Economist at Citibank from 1979 to 1984. He also analyzed pricing behavior in the metals industry for the Council on Wage and Price Stability in Washington, D.C. In 1999, Mr. Moeller received the award for most accurate forecast from the Forecasters' Club of New York. From 1990 to 1992 he was President of the New York Association for Business Economists. Mr. Moeller earned an M.B.A. in Finance from Fordham University, where he graduated in 1987. He holds a Bachelor of Arts in Economics from George Washington University.
More Economy in Brief


