 Global| Apr 16 2004
U.S. Consumer Sentiment Down
by:Tom Moeller
|in:Economy in Brief
Summary
The University of Michigans consumer sentiment index fell in mid-April to 93.2 from 95.8 in March. Consensus expectations had been for a firmer reading of 96.0. During the last ten years there has been an 76% correlation between the [...]
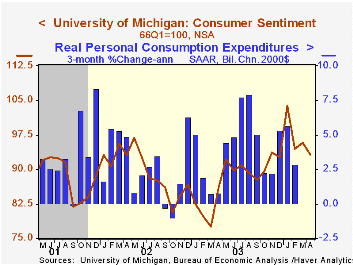
The University of Michigan’s consumer sentiment index fell in mid-April to 93.2 from 95.8 in March. Consensus expectations had been for a firmer reading of 96.0.
During the last ten years there has been an 76% correlation between the level of consumer sentiment and the y/y change in real PCE. That correlation has risen to 84% during the last five years.
Perceptions of current economic conditions slipped 2.5% to 104.1. The expectations index fell 2.9% to 86.2.
The University of Michigan survey is not seasonally adjusted.It is based on telephone interviews with 250 households nationwide on personal finances and business and buying conditions. The survey is expanded to a total of 500 interviews at month end.
| University of Michigan | Mid-April | Mar | Y/Y | 2003 | 2002 | 2001 |
|---|---|---|---|---|---|---|
| Consumer Sentiment | 93.2 | 95.8 | 8.4% | 87.6 | 89.6 | 89.2 |
| Current Conditions | 104.1 | 106.8 | 8.0% | 97.2 | 97.5 | 100.1 |
| Consumer Expectations | 86.2 | 88.8 | 8.7% | 81.4 | 84.6 | 82.3 |
by Tom Moeller April 16, 2004
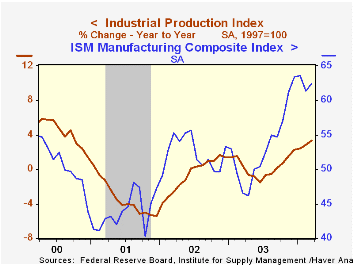
Industrial production fell 0.2% last month as utility output fell 2.4% for the second consecutive monthly decline. Consensus expectations had been for a 0.4% March increase.
Production in the factory sector was unchanged (3.6% y/y) following the unrevised 1.0% February surge.
Output in selected high-technology industries jumped 1.4% m/m (26.6% y/y), but that was only about half the monthly gains during the prior two months. Output of semiconductors & related equipment rose 2.5% (49.1% y/y) and output of computers & peripheral equipment jumped 2.4% (20.2% y/y). Output of communications equipment fell 1.9% (-3.6% y/y).
Excluding high-tech factory output fell 0.1% (+2.2% y/y) following the 0.9% February spike. Output of motor vehicles & parts fell 2.2% (+6.7% y/y) and reversed the February increase. Machinery output added 0.5% (9.0% y/y) to an upwardly revised 2.9% February. Output of furniture jumped 1.1% (-0.2% y/y) but non-durables output added only 0.1% (0.4% y/y).
Total capacity utilization fell to 76.5%. Growth in capacity remained at a low 1.1% y/y.
| Production & Capacity | Mar | Feb | Y/Y | 2003 | 2002 | 2001 |
|---|---|---|---|---|---|---|
| Industrial Production | -0.2% | 0.8% | 3.3% | 0.3% | -0.6% | -3.4% |
| Capacity Utilization | 76.5% | 76.7% | 74.8%(3/03) | 74.8% | 75.6% | 77.4% |
by Tom Moeller April 16, 2004
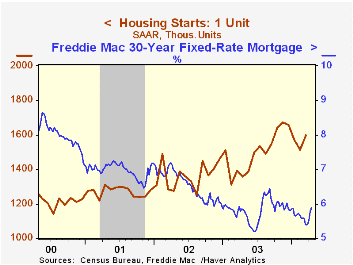
Housing starts jumped 6.4% last month, recovering from a 2.6% drop in February that was revised shallower. March starts were just 2.3% below the record high level in November 2003. Consensus forecasts had been for 1.91M starts.
Single family starts surged 5.5% following three consecutive months of decline. In March single family starts were 4.4% below the record of November 2003.
Multi-family starts jumped 9.7% to a four year high. The previously reported decline in February was revised to a slight increase.
Starts rose across the country's regions last month except the Northeast where starts fell 4.9% (12.3% y/y) after the 22.9% spike in February. In the South starts rose 8.5% (+16.1% y/y) and in the West they rose 3.7% (+19.0% y/y). In the Midwest starts rose 10.6% (+13.0% y/y).
Building permits rose a moderate 1.9% m/m (+15.3% y/y) following two months of decline.
| Housing Starts (000s, AR) | Mar | Feb | Y/Y | 2003 | 2002 | 2001 |
|---|---|---|---|---|---|---|
| Total | 2,007 | 1,887 | 15.2% | 1,848 | 1,711 | 1,601 |
| Single-family | 1,599 | 1,515 | 14.8% | 1,501 | 1,364 | 1,272 |
| Multi-family | 408 | 372 | 16.9% | 347 | 347 | 330 |
| Building Permits | 1,946 | 1,909 | 15.3% | 1,831 | 1,750 | 1,637 |
by Tom Moeller April 16, 2004
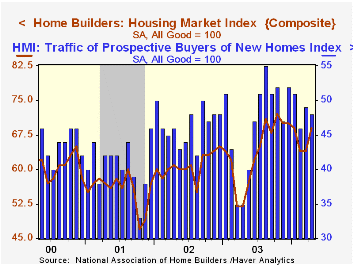
The Composite Housing Market Index reported by the National Association of Home Builders (NAHB) surged five points in April to 69 and returned to the high for 2004.
During the last fifteen years there has been a 79% correlation between the y/y change in the NAHB index and the change in single family housing starts.
The sub index which measures expected home sales in six months also returned to the high for 2004.
The index of current market conditions for home sales similarly rebounded to the high for the year.
Traffic of prospective buyers fell modestly in April (+37.1% y/y).
The NAHB index is a diffusion index based on a survey of builders. Readings above 50 signal that more builders view conditions as good than poor.
Visit the National Association of Home Builders using this link.
| Nat'l Association of Home Builders | April | Mar | April '03 | 2003 | 2002 | 2001 |
|---|---|---|---|---|---|---|
| Composite Housing Market Index | 69 | 64 | 52 | 64 | 61 | 56 |

Tom Moeller
AuthorMore in Author Profile »Prior to joining Haver Analytics in 2000, Mr. Moeller worked as the Economist at Chancellor Capital Management from 1985 to 1999. There, he developed comprehensive economic forecasts and interpreted economic data for equity and fixed income portfolio managers. Also at Chancellor, Mr. Moeller worked as an equity analyst and was responsible for researching and rating companies in the economically sensitive automobile and housing industries for investment in Chancellor’s equity portfolio. Prior to joining Chancellor, Mr. Moeller was an Economist at Citibank from 1979 to 1984. He also analyzed pricing behavior in the metals industry for the Council on Wage and Price Stability in Washington, D.C. In 1999, Mr. Moeller received the award for most accurate forecast from the Forecasters' Club of New York. From 1990 to 1992 he was President of the New York Association for Business Economists. Mr. Moeller earned an M.B.A. in Finance from Fordham University, where he graduated in 1987. He holds a Bachelor of Arts in Economics from George Washington University.
More Economy in Brief


