 Global| Sep 16 2005
U.S. Consumer Sentiment Depressed
by:Tom Moeller
|in:Economy in Brief
Summary
The September Consumer Sentiment Index from the University of Michigan cratered 13.7% m/m to 76.9, the lowest level in over ten years, as consumer expectations were depressed 17.3% by Hurricane Katrina (and probably by higher gasoline [...]
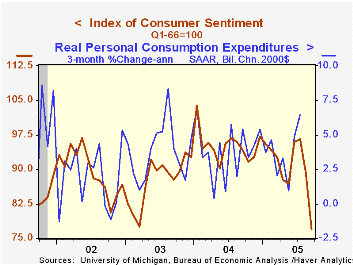
The September Consumer Sentiment Index from the University of Michigan cratered 13.7% m/m to 76.9, the lowest level in over ten years, as consumer expectations were depressed 17.3% by Hurricane Katrina (and probably by higher gasoline prices).
The 12 month expected inflation rate surged to 5.7% from 3.7% in August and that helped drop expectations for growth in real family income to the lowest level since 1992. Moreover, unemployment was expected to rise but interest rates were expected to fall.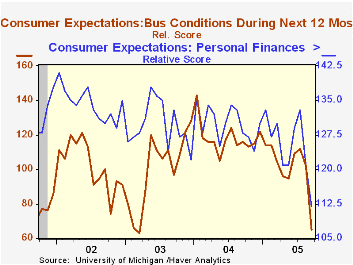
The current conditions index fell 9.7% m/m, roughly double the decline in August. Personal finances were viewed being at their worst level in over two years and current buying conditions also fell hard.
The University of Michigan survey is not seasonally adjusted.The mid-month survey is based on telephone interviews with 250 households nationwide on personal finances and business and buying conditions. The survey is expanded to a total of 500 interviews at month end.
| University of Michigan | Sept | August | Y/Y | 2004 | 2003 | 2002 |
|---|---|---|---|---|---|---|
| Consumer Sentiment | 76.9 | 89.1 | -18.4% | 95.2 | 87.6 | 89.6 |
| Current Conditions | 97.7 | 108.2 | -5.8% | 105.6 | 97.2 | 97.5 |
| Consumer Expectations | 63.6 | 76.9 | -27.7% | 88.5 | 81.4 | 84.6 |
by Tom Moeller September 16, 2005
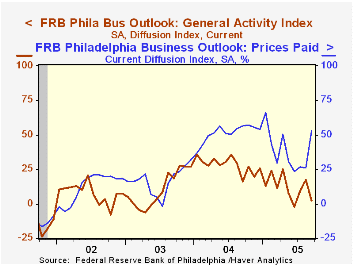
The Philadelphia Fed's Index of General Business Conditions in the manufacturing sector fell sharply in September to 2.2 from 17.5, reflecting damage caused by Hurricane Katrina. Consensus expectations had been for a lesser decline to 13.3.
During the last ten years there has been a 68% correlation between the level of the Philadelphia Fed Business Conditions Index and three month growth in factory sector industrial production. There has been a 50% correlation with q/q growth in real GDP.
The sub index measuring new orders was -0.5, negative for the first month in over two years. The shipments index also fell and reversed most of the August rise. The level of 13.2 was down a ton from this year's high of 29.4. The index covering the number of employees halved the August level and fell to 2.7. During the last ten years there has been a 64% correlation between the employment index and the three month growth in factory payrolls.
The business conditions index reflects a separate survey question, not the sub indexes.
The separate index of expected business conditions in six months fell sharply to 7.0 after the August jump to its best level of 2005.
The prices paid index surged and doubled the August level. During the last ten years there has been a 75% correlation between the prices paid index and the three month growth in the intermediate goods PPI. The correlation with the finished goods PPI has been 50% and with the CPI it's been 43%.
The Philadelphia Fed index is based on a survey of 250 regional manufacturing firms, but these firms sell nationally and internationally.
The latest Business Outlook survey from the Philadelphia Federal Reserve Bank can be found here.
| Philadelphia Fed Business Outlook | Sept | Aug | Sept | 2004 | 2003 | 2002 |
|---|---|---|---|---|---|---|
| General Activity Index | 2.2 | 17.5 | 15.9 | 28.1 | 10.6 | 7.7 |
| Prices Paid Index | 52.7 | 25.9 | 56.7 | 51.3 | 16.8 | 12.3 |
by Tom Moeller September 16, 2005
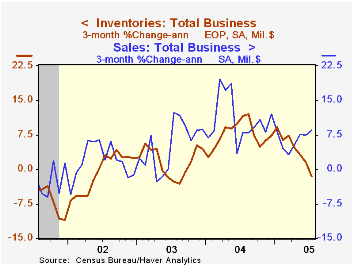
Total business inventories fell in July for the second month. The decline lowered the three month change in inventories to -1.5% (AR) versus a 12.1% peak rate of accumulation through last August. The ratio of inventories-to-sales dropped to a new record low of 1.26 as business sales rose 1.1% (8.2% y/y), goosed by a surge in auto sales.
Retail inventories plummeted 1.8% due to a 5.4% drop in auto inventories. Excluding autos, however, retail inventories fell only slightly (+5.9% y/y). Furniture inventories fell 0.2% (+7.9% y/y) and inventories of apparel were unchanged (5.9% y/y).
Factory sector inventories rose for the first month since March.
Wholesale inventories fell 0.1% pulling three month growth down to 2.8%, the lowest since 2003. During the last ten years there has been a 64% correlation between the y/y change in wholesale inventories and the change in imports of merchandise.
| Business Inventories | July | June | Y/Y | 2004 | 2003 | 2002 |
|---|---|---|---|---|---|---|
| Total | -0.5% | -0.0% | 4.2% | 7.7% | 1.4% | 1.6% |
| Retail | -1.8% | -0.5% | -0.4% | 5.7% | 3.9% | 5.9% |
| Retail excl. Autos | -0.0% | 0.4% | 5.9% | 5.9% | 2.0% | 2.3% |
| Wholesale | -0.1% | 0.4% | 8.2% | 10.8% | 2.0% | 1.2% |
| Manufacturing | 0.5% | 0.1% | 6.0% | 7.5% | -1.3% | -1.8% |
by Tom Moeller September 16, 2005
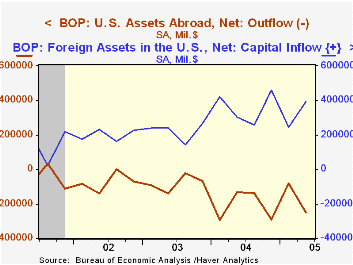
The US current account deficit improved last quarter but it was from a 1Q record that was revised deeper. The 2Q deficit of $195.7B amounted to 6.3% of GDP. Consensus expectations had been for greater improvement to $193.0B.
The deficit in merchandise trade deteriorated to $186.9B from an unrevised $186.3B in 1Q. Exports grew 4.5% (11.7% y/y) and imports rose 2.6% (12.7% y/y).
The surplus on services improved for the third consecutive quarter to $13.6B from a downwardly revised 1Q surplus. Exports of services grew 1.2% (10.3% y/y and imports rose 1.0% (9.7% y/y).
From the capital account, US foreign direct investment abroad fell to $33.6B from an upwardly revised 1Q and foreign direct investment in the US nearly halved q/q to $17.6B.
Unwinding the Current Account Deficit from the Federal Reserve Bank of St. Louis can be found here.
| US Int'l Balance of Payments | 2Q '05 | 1Q '05 | Y/Y | 2004 | 2003 | 2002 |
|---|---|---|---|---|---|---|
| Current Account Deficit | $195.7B | $198.7B | $166.6B | $668.1B | $519.7B | $475.2B |
| Goods/Services/Income Deficit | $173.8B | $172.4B | $146.1B | $587.1B | $448.5B | $411.2B |
| Exports | 4.2% | 2.1% | 14.4% | 14.9% | 6.8% | -3.7% |
| Imports | 3.2% | 2.6% | 15.6% | 18.1% | 7.3% | 1.6% |
| Unilateral Transfers Deficit | $21.9B | $26.3B | $20.5B | $80.9B | $71.2B | $64.0B |
by Carol Stone September 16, 2005
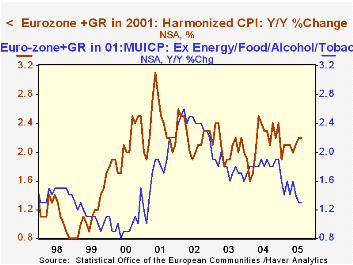
The Euro-Zone CPI inflation picked up marginally in August, reaching 2.24% after July's 2.16% year-on-year pace. Notably, however, these are both lower than the 2004 rate of 2.36%.
Eurostat reported these data this morning at 5:00AM New York time. Haver's "European shift" posted the headline percentage changes at 5:04 and the full set of files, including harmonized CPIs for all the constituent countries, at 5:13AM. The European shift gets into full swing at about 1:30AM and overlaps a few hours with regular daytime operations. Thus, all the major European releases are updated in "real time" for European users.
In the table below, we highlight a few of the major CPI components. The "core" excluding energy food, alcohol and tobacco was steady at a 1.32% 12-month pace. Interestingly, the slight increase in overall inflation was not due to faster energy price increases. At 11.6% over a year ago, energy prices went up plenty fast, but this was actually a bit less than in July. Food, alcohol and tobacco increased to 1.5% from 1.2% in July. At the same time, both the core and the food subset are slower than they were during 2004.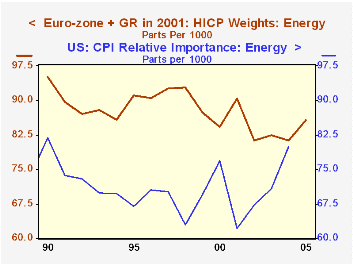
Several commodity and service groupings are running slower than they did in 2004: household equipment and supplies, clothing, education expenses and "miscellaneous" items. Among groups with stronger prices, housing expenses for utilities are accelerating, but inflation of rents and home repair costs is holding steady. Communications rates are declining, but less than they were last year. Transportation costs are mixed; vehicle prices have picked up, but only a little. Vehicle operations (including fuel) actually saw their major advance last year, and while inflation there is high, it has been no worse than during 2004. Transportation services have a very ragged pattern, which might be seen as evidence that the whole market for these fares is unsettled.
At the consumer price level in Europe, energy constitutes 8.6% of the total index. This is remarkably similar to the US, where the "relative importance" of energy in the CPI is almost exactly 8% -- or has been. These modest weights are likely to change, though, perhaps more than this year's move, which in Europe was 4.3 percentage points over 2004.
| MUICP*Year/Year % Changes | Aug 2005 | July 2005 | June 2005 | December/December|||
|---|---|---|---|---|---|---|
| 2004 | 2003 | 2002 | ||||
| Total | 2.24 | 2.16 | 2.07 | 2.36 | 1.96 | 2.28 |
| Ex Energy, Food, Alcohol & Tobacco | 1.32 | 1.32 | 1.32 | 1.86 | 1.62 | 2.21 |
| Energy | 11.63 | 11.80 | 9.42 | 6.99 | 1.78 | 3.69 |
| Food, Alcohol & Tobacco | 1.52 | 1.17 | 1.17 | 1.96 | 3.62 | 2.07 |
| Household Supplies, Equipment & Maintenance | 0.54 | 0.64 | 0.82 | 0.82 | 1.11 | 1.40 |
| Clothing & Footwear | -0.77 | -0.48 | 0.27 | 0.63 | 1.00 | 1.77 |
| Recreation & Culture | -0.09 | -0.19 | -0.29 | -0.09 | -0.19 | 0.56 |
| Hotels & Restaurants | 2.51 | 2.60 | 2.46 | 2.66 | 2.82 | 4.51 |

Tom Moeller
AuthorMore in Author Profile »Prior to joining Haver Analytics in 2000, Mr. Moeller worked as the Economist at Chancellor Capital Management from 1985 to 1999. There, he developed comprehensive economic forecasts and interpreted economic data for equity and fixed income portfolio managers. Also at Chancellor, Mr. Moeller worked as an equity analyst and was responsible for researching and rating companies in the economically sensitive automobile and housing industries for investment in Chancellor’s equity portfolio. Prior to joining Chancellor, Mr. Moeller was an Economist at Citibank from 1979 to 1984. He also analyzed pricing behavior in the metals industry for the Council on Wage and Price Stability in Washington, D.C. In 1999, Mr. Moeller received the award for most accurate forecast from the Forecasters' Club of New York. From 1990 to 1992 he was President of the New York Association for Business Economists. Mr. Moeller earned an M.B.A. in Finance from Fordham University, where he graduated in 1987. He holds a Bachelor of Arts in Economics from George Washington University.
More Economy in Brief


