 Global| May 18 2007
U.S. Consumer Sentiment Bounced Back but Current Conditions Slip
Summary
The chart on the left shows that many patterns for current conditions and expectations precede the economys slip into recession. As we evaluate this years pattern nothing is very telling. Current conditions are holding up, basically [...]
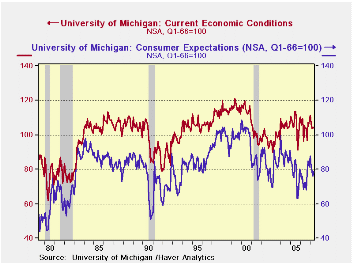
The chart on the left shows that many patterns for current conditions and expectations precede the economy’s slip into recession. As we evaluate this year’s pattern nothing is very telling. Current conditions are holding up, basically stabilizing in April and this month after a minor slide from a local peak reached in January. Consumer sentiment is up this month and has a saw-tooth pattern in the recovery. Sentiment is at levels more reminiscent of the 1982 recovery that of the 1991 recovery. Indeed if you remove the last set of recession bands from the chart the slide in expectations appears to be one ongoing episode of irregularly sliding expectations dating back to the lofty levels reached in 2000 ahead of the recession.
Current conditions have a more normal-looking recession pattern. What we cannot tell is if we are at a point like in 1996 when current conditions, after softening, rose sharply or if we are at a point like May 2000 where a series of slips and rebounds eventually gave way to a recession. One thing seems clear and that is we are apt to learn more from watching current conditions than by watching expectations since the later seem to range so widely and have been cyclically unruly. In that regard we are wary of the slippage in current conditions reported this month.
The table below shows us that the major components of the U of M index are still quite firm in their recovery zone. Still the current conditions index is only in the 58th percentile of its recovery range of values. Expectations have dropped to the 43rd percentile. These are firm readings; not declining readings but the economy still has lost a lot of its momentum.
The problem with understanding these measures is that they hold in ranges until the ’bad event’ of recession kicks in then they fall sharply. So finding that each has lost a lot of ground within its respective range means we have to be somewhat wary of these readings. Certainly, the economy is getting hit with another series of shocks from oil prices. The rebound in sentiment is only somewhat reassuring, but it has a rising stock market to help it out. Keep your eye on current conditions; it’s the measure that must respond positively in coming months if the growth is going to continue.
| Sentiment | Current | Expectations | |
| Prelim | 88.7 | 103.8 | 79.0 |
| Last Month | 87.1 | 104.6 | 75.9 |
| Mo/Mo % | 1.8% | -0.8% | 4.1% |
| 2-Mos | 0.3% | 0.3% | 0.4% |
| Yr/Yr% | 12.1% | 8.0% | 15.8% |
| In Recovery: Max,Min, Avg & Percentile | |||
| Max | 103.8 | 113.5 | 100.1 |
| Min | 74.2 | 90.0 | 63.2 |
| Average | 89.7 | 102.5 | 81.5 |
| percentile | 49.0% | 58.7% | 42.8% |
| Cycle peak | 103.8 | 113.5 | 100.1 |
| % of Peak | 85.5 | 91.5 | 78.9 |
by Carol Stone May 18, 2007

Gasoline prices in the US hit a record high last week (ended May 14), $3.103 a gallon for regular grade, according to the Department of Energy, up 4.9 cents from the week before. And the main summer driving season hasn't started yet.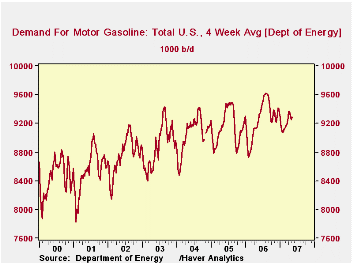
Oddly, it seems, the price of gasoline has risen more than proportionately with crude oil prices. This is readily apparent in the first graph, which includes regular gasoline and two crudes, West Texas Intermediate and UK Brent Blend. We see there that in the last two years of dramatically higher petroleum prices, gasoline prices have fallen more sharply in the winter and risen more in the spring. The extremity of the up-move this year is greater than last year. In the second graph, it is evident that demand for gasoline did not fall as much over the winter as in any recent year. Consequently, gasoline inventories are lower now than usual in the spring, seen in graph 3, so prices are rising more rapidly.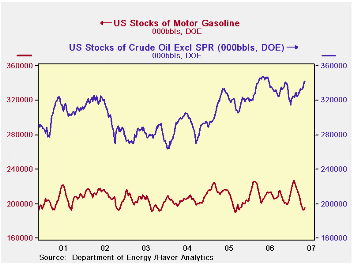
The other feature of the energy markets that continues to fascinate us is the growth of demand for petroleum generally in emerging market countries and in China. The last graph -- another illustration of the new multiple-series and calculation features of the upcoming version of DLXVG3 software -- shows that Europe has decreased markedly as a share of world petroleum demand. The US is up slightly in the most recent few months, touching almost exactly 25% in April; but this is still modestly lower than the range that prevailed before 2004. China, in sharp contrast, is expanding rapidly, basically doubling its share since 1995 and raising its use by 60% in the last 5 years.
The data here on prices and US inventories are in the OILWKLY database, and those on international demand comparisons are in the OMI database, which is provided by Haver's partner in energy information, Energy Intelligence.
| May 14 | May 7 | Apr 2007 | Yr-Ago Week | 2006 | 2005 | 2000 | |
|---|---|---|---|---|---|---|---|
| Gasoline, US Regular Grade (cents/gal) | 310.3 | 305.4 | 284.5 | 294.7 | 257.2 | 227.0 | 148.4 |
| Crude Oil, UK Brent ($/barrel) | May 11 | May 4 | 67.58 | 70.47 | 65.19 | 54.58 | 28.53 |
| 66.92 | 66.92 | ||||||
| West Texas Intermed | 61.90 | 63.79 | 63.91 | 71.60 | 66.13 | 56.50 | 30.36 |

Robert Brusca
AuthorMore in Author Profile »Robert A. Brusca is Chief Economist of Fact and Opinion Economics, a consulting firm he founded in Manhattan. He has been an economist on Wall Street for over 25 years. He has visited central banking and large institutional clients in over 30 countries in his career as an economist. Mr. Brusca was a Divisional Research Chief at the Federal Reserve Bank of NY (Chief of the International Financial markets Division), a Fed Watcher at Irving Trust and Chief Economist at Nikko Securities International. He is widely quoted and appears in various media. Mr. Brusca holds an MA and Ph.D. in economics from Michigan State University and a BA in Economics from the University of Michigan. His research pursues his strong interests in non aligned policy economics as well as international economics. FAO Economics’ research targets investors to assist them in making better investment decisions in stocks, bonds and in a variety of international assets. The company does not manage money and has no conflicts in giving economic advice.
More Economy in Brief


