 Global| Jan 11 2010
U.S. Consumer Credit Usage Decline Reaches Historic Proportion
by:Tom Moeller
|in:Economy in Brief
Summary
Is the consumer not attempting to borrow or is credit not being extended by the lender? It's hard to say but the Federal Reserve reported late-Friday that consumer credit outstanding fell by a record $17.5B m/m during November [...]
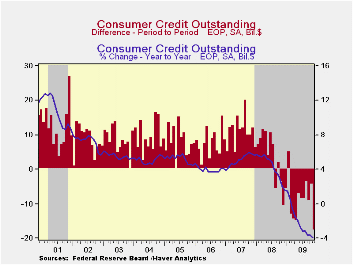 Is the
consumer not attempting to borrow or is credit not being extended by
the lender? It's hard to say but the Federal Reserve reported
late-Friday that consumer credit outstanding fell by a record $17.5B
m/m during November following a $4.2B October decline that was revised
slightly deeper from the initial report. The latest was the fourteenth
monthly drop since summer 2008. Moreover, the 3.9% y/y pullback in
credit outstanding set another historic record as consumers retrenched
and took account of debt-laden personal balance sheets along with job
market deterioration. Consumer credit outstanding as a percentage of
disposable income fell to 22.1% from its 2005 high of 24.7%.
Nevertheless, these rates remain up from the low near 16% in
1992.
Is the
consumer not attempting to borrow or is credit not being extended by
the lender? It's hard to say but the Federal Reserve reported
late-Friday that consumer credit outstanding fell by a record $17.5B
m/m during November following a $4.2B October decline that was revised
slightly deeper from the initial report. The latest was the fourteenth
monthly drop since summer 2008. Moreover, the 3.9% y/y pullback in
credit outstanding set another historic record as consumers retrenched
and took account of debt-laden personal balance sheets along with job
market deterioration. Consumer credit outstanding as a percentage of
disposable income fell to 22.1% from its 2005 high of 24.7%.
Nevertheless, these rates remain up from the low near 16% in
1992.
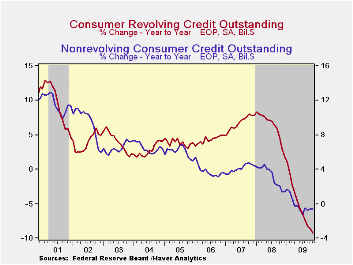
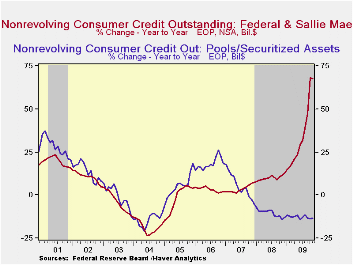
Usage of non-revolving credit (autos & other consumer durables), which accounts for nearly two-thirds of the total, fell $3.8B after a $3.2B October increase. The 0.6% y/y decline reflected a 13.2% drop in pools of securitized assets, an 11.2% decline in finance company lending and a 7.2% drop in nonfinancial business credit extensions. These were mostly offset by the federal government & Sallie Mae which expanded lending by more than two-thirds y/y and commercial bank lending which rose 1.1%. The latter figure, however, was down from 13% growth early in 2008.
Revolving credit usage fell a record $13.7B during November as part of a pullback that began late in 2008. The latest was part of a 9.3% y/y decline which also was by far a record. Versus November 2009, finance companies lowered lending by 37.9%, commercial bank lending fell 9.8%, pools of securitized assets fell 5.8%, savings institutions pulled back 3.9% y/y. Loans from credit unions offset some of these declines with a 6.2% increase.
These figures are the major input to the Fed's quarterly Flow of Funds accounts for the household sector.
Credit data are available in Haver's USECON database. The Flow of Funds data are in Haver's FFUNDS database.
Why Are Banks Holding So Many Excess Reserves? from the Federal Reserve Bank of New York is available here here.
| Consumer Credit Outstanding (m/m Chg, SAAR) | November | October | September | Y/Y | 2008 | 2007 | 2006 |
|---|---|---|---|---|---|---|---|
| Total | $-17.5B | $-4.2B | $-8.9B | -3.9% | 1.6% | 5.6% | 4.1% |
| Revolving | $-13.7B | $-7.3B | $-8.0B | -9.3% | 1.9% | 7.8% | 5.0% |
| Non-revolving | $-3.8B | $3.2B | $-1.0B | -0.6% | 1.4% | 4.4% | 3.6% |

Tom Moeller
AuthorMore in Author Profile »Prior to joining Haver Analytics in 2000, Mr. Moeller worked as the Economist at Chancellor Capital Management from 1985 to 1999. There, he developed comprehensive economic forecasts and interpreted economic data for equity and fixed income portfolio managers. Also at Chancellor, Mr. Moeller worked as an equity analyst and was responsible for researching and rating companies in the economically sensitive automobile and housing industries for investment in Chancellor’s equity portfolio. Prior to joining Chancellor, Mr. Moeller was an Economist at Citibank from 1979 to 1984. He also analyzed pricing behavior in the metals industry for the Council on Wage and Price Stability in Washington, D.C. In 1999, Mr. Moeller received the award for most accurate forecast from the Forecasters' Club of New York. From 1990 to 1992 he was President of the New York Association for Business Economists. Mr. Moeller earned an M.B.A. in Finance from Fordham University, where he graduated in 1987. He holds a Bachelor of Arts in Economics from George Washington University.
More Economy in Brief


