 Global| May 10 2010
U.S. Consumer Credit RetrenchmentEases
by:Tom Moeller
|in:Economy in Brief
Summary
Consumers have backed away from reducing debt as rapidly as during last year. The Federal Reserve reported late-Friday that consumer credit outstanding rose $2.0B during March following a revised $6.0B February drop. That decline was [...]
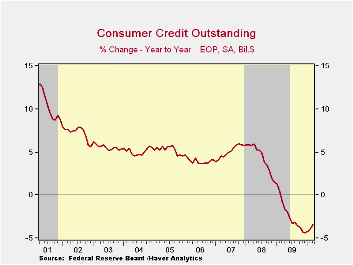 Consumers
have backed away from reducing debt as rapidly as during last year. The
Federal Reserve reported late-Friday that consumer credit outstanding
rose $2.0B during March following a revised $6.0B February drop. That
decline was half the amount reported last month, suggesting that
consumers are more confident about spending. Despite this seeming
stabilization in credit outstanding, the 3.4% y/y decline ending in
March remained a near record.
Consumers
have backed away from reducing debt as rapidly as during last year. The
Federal Reserve reported late-Friday that consumer credit outstanding
rose $2.0B during March following a revised $6.0B February drop. That
decline was half the amount reported last month, suggesting that
consumers are more confident about spending. Despite this seeming
stabilization in credit outstanding, the 3.4% y/y decline ending in
March remained a near record.
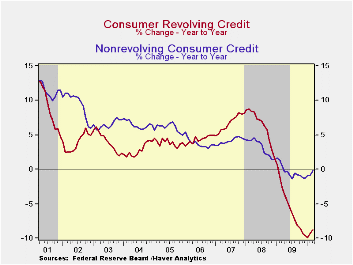
Cutting the usage of revolving
credit remained in the forefront of consumers' pullback. A $3.2B March
decline followed a $6.0B drop and left usage down a near-record 8.8%
y/y. Pools of securitized assets led with a sharp m/m (-84.7% y/y drop.
Finance companies, however, countered and increased lending 29.3% y/y
due to a one month March spike. Commercial bank lending also jumped in
 March
and was up by three- quarters from last year. Loans
from credit unions rose 6.2% y/y while lending by savings institution
increased 4.7%.
March
and was up by three- quarters from last year. Loans
from credit unions rose 6.2% y/y while lending by savings institution
increased 4.7%.
Usage of non-revolving credit (autos & other
consumer durables), which accounts for nearly two-thirds of the total,
actually rose $5.2B after the $0.2B February slip. Non-revolving credit
had fallen modestly during the recession, but has been relatively
stable for a year. Year-to-year figures ending in March show
that Federal government & Sallie Mae lending expanded by nearly
three-quarters while commercial bank lending also rose 6.6%. These
gains were offset a nearly one-half decline in pools of securitized
assets, a 12.9% fall in savings institutions, a 4.3% decline in finance
companies and a 3.1% fall in credit union lending.
During
the last ten years, there has been a 60% correlation between the y/y
change in credit outstanding and the change in personal consumption
expenditures. Moreover, these figures are the major input to
the Fed's quarterly Flow of Funds accounts for the household sector.
Credit data are available in Haver's USECON database. The Flow of Funds data are in Haver's FFUNDS database.
| Consumer Credit Outstanding (m/m Chg, SAAR) | March | February | January | Y/Y | 2009 | 2008 | 2007 |
|---|---|---|---|---|---|---|---|
| Total | $2.0B | $-6.2B | $6.5B | -3.4% | -4.4% | 1.5% | 5.7% |
| Revolving | $-3.2B | $-6.0B | $-4.3B | -8.8% | -9.6% | 1.6% | 8.1% |
| Non-revolving | $5.2B | $-0.2B | $10.8B | -0.2% | -1.3% | 1.5% | 4.4% |
by Tom Moeller May 10, 2010
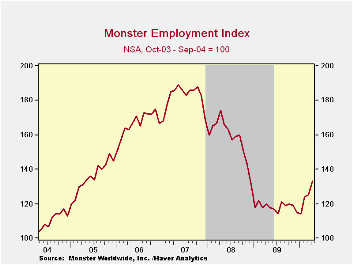
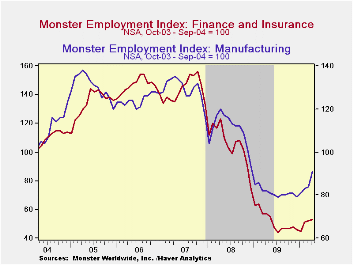
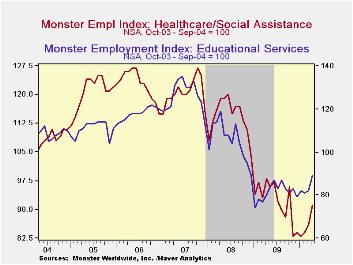
The newspaper, word-of-mouth, and personal contacts each are tools for job-searching. In this the internet age, however, postings of available jobs can also be found online. Monster.com, provided by Monster Worldwide Inc., is a web-site which keeps track of many job listings. The monthly figures are available by Census region, industry, and by occupation. Haver Analytics carries Monster's data back to 2003 in its SURVEYS database.
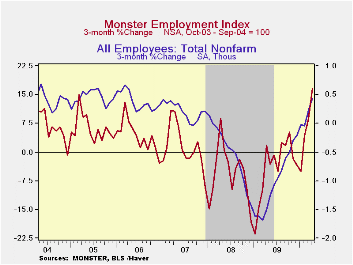
Since its inception, the three-month change in the Monster index has a 68% correlation with growth in nonfarm payrolls.
Keep in mind that 2003-04 = 100 is the base for the Monster Index. From the end of the last recession until this past January, it has stayed in a range from 114 to 121. Most recently, however, it's broken from that range -- to the upside. The April figure of 133 was the strongest in the last three months of improved readings. Moreover, the figure was up 16.7% from its trough. For the most part, double-digit gains have been logged across most of the U.S. Only two regions are substantially lagging with single-digit readings in the Mountain and in the East-South-Central areas.
By industry, recent improvement also has been broad-based with strong double-digit growth in the construction, manufacturing and retail trade sectors. Job openings in the white-collar finance & insurance, management and professional, scientific/tech services industries also have grown at double-digit rates. Jobs availability in health-care and education have grown at slower rates.
Looking once again at the overall level since 2003 shows variation in industry postings. A level of 133 in the total indicates that since inception, there has been a one-third rise in on-line advertising for overall employment. That reflects a range of near-doubling of listings for construction and government jobs to a halving of listings for positions in finance & insurance.
| April | March | February | April '09 | 2009 | 2008 | 2007 | |
|---|---|---|---|---|---|---|---|
| Monster Employment Index | 133 | 125 | 124 | 120 | 118 | 158 | 182 |
| Construction | 195 | 176 | 165 | 170 | 167 | 202 | 225 |
| Manufacturing | 91 | 84 | 83 | 82 | 81 | 111 | 129 |
| Retail Trade | 137 | 124 | 116 | 118 | 124 | 158 | 184 |
| Finance & Insurance | 53 | 52 | 51 | 57 | 52 | 105 | 143 |
| Real Estate & Rental Leasing | 62 | 63 | 57 | 53 | 54 | 92 | 135 |
| Company & Enterprise Mgmt. | 117 | 111 | 111 | 107 | 107 | 144 | 157 |
| Education | 89 | 82 | 81 | 80 | 81 | 106 | 126 |
| Heath Care/Social Assistance | 91 | 86 | 84 | 98 | 92 | 114 | 121 |
| Public Administration | 183 | 182 | 190 | 197 | 188 | 199 | 161 |
by Robert Brusca May 10, 2010
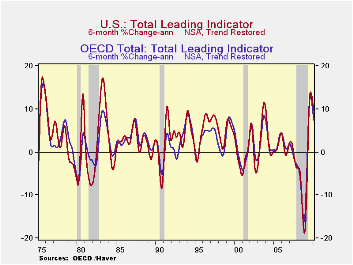
After a jackrabbit jump the OECD trend restored Leading Economic indicators are slowing their pace. Still, viewed over six months which is the OECD’s preferred way of using them, the grow rates across the OECD region remain quite strong, Japan is even accelerating to the second best growth rate in the table. Still, all rates decay over three-months compared to six months.
The challenge to growth, however, is for the period ahead. Evidence is that China is slowing. The Greek crisis and its knock-on effects damaged Europe and have more permanently helped to re-shape Europe’s political power structure.
Now a new support package is in place for Greece and a one trillion dollar backstop for Europe’s laggards has been set up. The ECB is supporting this with bond purchases and the Fed has reactivated its swap lines to help. How much will these new actions compensate for the damage that came before them? How weak will China actually be? And how much if at all will the US economy and its financial markets be damaged by its one-off (?) intra-day thousand point drop in the DJIA from last week? Investing dollars, yen and euros want to know.
As of March things look good across the OECD area. The most up-to-date economic data from the US have been very upbeat. Europe’s most recent readings have been good as well, but the new investor confidence reading from Sentix turned sharply and decisively into negative territory.
Nonetheless it’s a good thing to have the economies hit by these adverse forces while they are gaining momentum. All the trends will bear watching. Upward momentum bolstered with these new pushes by policymakers yet may carry the day.
| OECD Trend-restored leading Indicators | ||||
|---|---|---|---|---|
| Growth progression-SAAR | ||||
| 3Mos | 6Mos | 12mos | Yr-Ago | |
| OECD | 5.6% | 7.3% | 10.2% | -11.1% |
| OECD7 | 6.0% | 7.8% | 10.5% | -12.5% |
| OECD.Ezone | 2.9% | 5.1% | 9.4% | -11.4% |
| OECD.Japan | 8.0% | 9.1% | 8.8% | -14.3% |
| OECD US | 8.4% | 9.7% | 11.5% | -12.8% |
| Six month readings at 6-Mo Intervals: | ||||
| Recent six | 6Mo Ago | 12Mo Ago | 18MO Ago | |
| OECD | 7.3% | 13.1% | -10.8% | -11.4% |
| OECD7 | 7.8% | 13.3% | -13.1% | -11.9% |
| OECD.Eur | 5.1% | 13.8% | -9.0% | -13.7% |
| OECD.Japan | 9.1% | 8.6% | -18.1% | -10.3% |
| OECD US | 9.7% | 13.4% | -14.6% | -11.1% |
| Slowdowns indicated by BOLD RED | ||||
by Louise Curley May 10,2010
 The
European
Union, the IMF and the European Central Bank agreed today on a package
of emergency measures that are intended to stabilize financial
conditions in the Eurozone. Government deficits and rising
debt, particularly in Greece threatened the stability of the Euro
Area. By last Friday, the euro was down to $1.2746 a decline
of almost 16% from the high of $1.512 reached on December 3rd of last
year. In addition to uncertainty in Greece there were fears that other
countries, notably Portugal, Spain and Ireland would be next in line.
The continuation of the Euro Area was in question. The
success of the rescue plan will not be known for some time, however,
the initial response of the financial markets has been positive. The
euro has risen almost 2% today and stock markets around the world are
up sharply.
The
European
Union, the IMF and the European Central Bank agreed today on a package
of emergency measures that are intended to stabilize financial
conditions in the Eurozone. Government deficits and rising
debt, particularly in Greece threatened the stability of the Euro
Area. By last Friday, the euro was down to $1.2746 a decline
of almost 16% from the high of $1.512 reached on December 3rd of last
year. In addition to uncertainty in Greece there were fears that other
countries, notably Portugal, Spain and Ireland would be next in line.
The continuation of the Euro Area was in question. The
success of the rescue plan will not be known for some time, however,
the initial response of the financial markets has been positive. The
euro has risen almost 2% today and stock markets around the world are
up sharply.
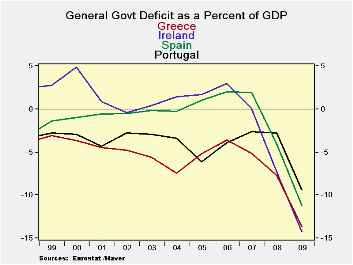
Data for the sixteen countries in Euro Area and the eleven
other countries that make up the European Union are available
 in
the Haver Data base--EUROSTAT. To illustrate the
seriousness of the problems confronting Greece, Portugal, Spain and
Ireland we have attached two charts. The first shows the
government deficit as a percentage of Gross Domestic Product on an
annual basis. In 2009, and conditions have probably worsened
since the, the government deficit as a percent of GDP was 9.4% in
Portugal, 11.2% in Spain, 13.6% in Greece and even higher at 14.3% in
Ireland. It should be noted that among the
convergence criteria for membership in the Euro Area, the deficit as a
percentage of GDP was expected to be no higher than 3%. Even
allowing for occasional shortfalls, the 2009 percentages are
alarming. As shown in the chart and the table
below, the deficit as a percentage of GDP for Greece has been
consistently above the 3% level.
in
the Haver Data base--EUROSTAT. To illustrate the
seriousness of the problems confronting Greece, Portugal, Spain and
Ireland we have attached two charts. The first shows the
government deficit as a percentage of Gross Domestic Product on an
annual basis. In 2009, and conditions have probably worsened
since the, the government deficit as a percent of GDP was 9.4% in
Portugal, 11.2% in Spain, 13.6% in Greece and even higher at 14.3% in
Ireland. It should be noted that among the
convergence criteria for membership in the Euro Area, the deficit as a
percentage of GDP was expected to be no higher than 3%. Even
allowing for occasional shortfalls, the 2009 percentages are
alarming. As shown in the chart and the table
below, the deficit as a percentage of GDP for Greece has been
consistently above the 3% level.
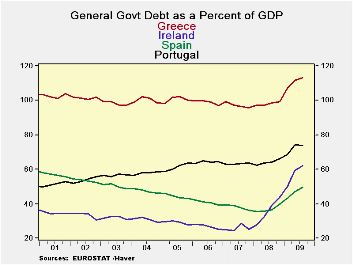
The second chart showing government debt as a percentage of GDP tells a similar story. (These data are quarterly.) Government Debt in Portugal was 73.7% of GDP in the third quarter of last year. In Spain it was 49.7%, in Ireland, 62.25 and in Greece,113.2%. In this case, Spain's debt as a percentage of GDP is below the convergence criterion of 60%. In Portugal and Ireland the debt to GDP percentages are not too far above the 60% standard, but in Greece, the percentage is almost double the standard and has been close to 100 over the past two years.
| 2009 | 2008 | 2007 | 2006 | 2005 | 2004 | 2003 | 2002 | |
|---|---|---|---|---|---|---|---|---|
| Deficit as % of GDP | ||||||||
| Portugal | -9.4 | -2.8 | -2.6 | -3.9 | -6.1 | -3.4 | -2.9 | -2.8 |
| Spain | -11.2 | -4.1 | 1.9 | 2.0 | 1.0 | -0.3 | -0.2 | -0.5 |
| Ireland | -14.2 | -7.3 | 0.1 | 3.0 | 1.7 | 1.4 | 0.4 | -0.4 |
| Greece | -13.6 | -7.7 | -5.1 | -3.6 | -5.2 | -7.5 | -5.6 | -4.8 |
| Debt as % of GDP | Q3 09 | Q2 09 | Q1 097 | Q4 08 | Q3 08 | Q2 08 | Q1 08 | Q4 07 |
| Portugal | 73.7 | 74.2 | 68.7 | 66.3 | 64.0 | 63.8 | 62.6 | 63.6 |
| Spain | 49.7 | 47.1 | 43.0 | 39.7 | 36.7 | 35.8 | 35.3 | 36.1 |
| Ireland | 62.2 | 59.3 | 49.9 | 44.0 | 38.9 | 32.4 | 27.6 | 25.2 |
| Greece | 113.2 | 111.4 | 107.0 | 99.2 | 98.5 | 97.5 | 97.3 | 94.1 |

Tom Moeller
AuthorMore in Author Profile »Prior to joining Haver Analytics in 2000, Mr. Moeller worked as the Economist at Chancellor Capital Management from 1985 to 1999. There, he developed comprehensive economic forecasts and interpreted economic data for equity and fixed income portfolio managers. Also at Chancellor, Mr. Moeller worked as an equity analyst and was responsible for researching and rating companies in the economically sensitive automobile and housing industries for investment in Chancellor’s equity portfolio. Prior to joining Chancellor, Mr. Moeller was an Economist at Citibank from 1979 to 1984. He also analyzed pricing behavior in the metals industry for the Council on Wage and Price Stability in Washington, D.C. In 1999, Mr. Moeller received the award for most accurate forecast from the Forecasters' Club of New York. From 1990 to 1992 he was President of the New York Association for Business Economists. Mr. Moeller earned an M.B.A. in Finance from Fordham University, where he graduated in 1987. He holds a Bachelor of Arts in Economics from George Washington University.
More Economy in Brief


