 Global| Nov 27 2012
U.S. Consumer Confidence Moves Higher
by:Tom Moeller
|in:Economy in Brief
Summary
The Conference Board's Consumer Confidence Index for November rose slightly to 73.7 from 73.1 in October, revised from 72.2. Consensus expectations had been 73.2 for this month. The latest figure was the highest since February 2008. [...]
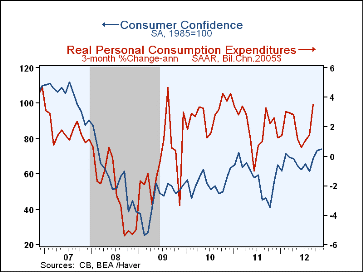

The Conference Board's Consumer Confidence Index for November rose slightly to 73.7 from 73.1 in October, revised from 72.2. Consensus expectations had been 73.2 for this month. The latest figure was the highest since February 2008. During the last ten years there has been a 47% correlation between the level of confidence and the three-month change in real PCE.
The expectations component rose 1.3% to 85.1 which was its highest level since February. An increased 22.2% thought business conditions would be better in six months. Also, an increased 20.3% thought there would be more jobs and 15.9% expected higher income.Consumers' reading of the present situation was essentially unchanged m/m at 56.6, still its highest level since September 2008. Confidence in the labor market improved greatly as a lessened 38.8% reported that jobs were hard to get, the least since April. A reduced 50.0% thought that jobs were not so plentiful. A lessened 14.4% thought business conditions were good.
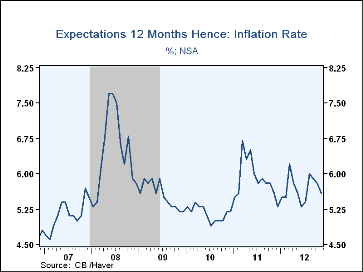
Expectations for inflation in the next twelve months fell m/m to 5.6% but remained up from the June low of 5.3%. The percentage of people looking for higher stock prices fell to 31.0% this month while the percent who are bearish fell to its least since April. The percentage of respondents planning to buy a home within six months fell to its lowest since April but the percent planning to buy a major appliance rose to its highest since April 2010.
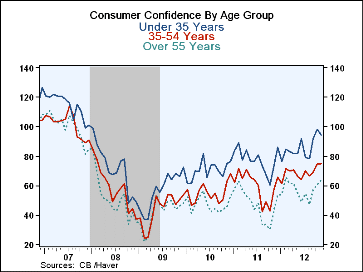
Consumer confidence varied greatly by age group. Those under 35 years old tended to be the most confident, nearly the highest level since 2007. The middle aged folks were somewhat less confident but those over 55 years were the least confident about the economy.
Headline figures on consumer confidence are carried in Haver's USECON database. The Conference Board's detailed data are found in Haver's CBDB database, and the consensus expectations figure is from Actions Economics, as tabulated in the AS1REPNA database.
Displaced Workers and the Great Recession from the Federal Reserve Bank of Cleveland is available here.
| Conference Board (SA, 1985=100) | Nov | Oct | Sep | Y/Y % | 2011 | 2010 | 2009 |
|---|---|---|---|---|---|---|---|
| Consumer Confidence Index | 73.7 | 73.1 | 68.4 | 33.5 | 58.1 | 54.5 | 45.2 |
| Present Situation | 56.6 | 56.7 | 48.7 | 47.8 | 36.2 | 25.7 | 24.0 |
| Expectations | 85.1 | 84.0 | 81.5 | 28.2 | 72.8 | 73.7 | 59.3 |
| Consumer Confidence By Age Group | |||||||
| Under 35 Years | 94.5 | 98.3 | 91.8 | 27.7 | 77.3 | 70.4 | 57.0 |
| Aged 35-54 Years | 75.1 | 74.3 | 69.1 | 29.9 | 59.8 | 55.1 | 44.1 |
| Over 55 Years | 63.8 | 60.9 | 56.8 | 46.0 | 47.3 | 47.4 | 41.9 |
U.S. Durable Goods Orders Are Flat
by Tom Moeller November 27, 2012
 Durable goods orders were unchanged (2.3% y/y) last month after a 9.2%
recovery during September. The figure contrasted with Consensus
expectations for a 1.0% decline. Fewer orders for transportation
equipment accounted for much of the weakness with a 3.1% (+14.4% y/y)
decline. Orders for nondefense aircraft were off 5.8% (+52.7% y/y) while orders
for defense aircraft fell 4.3% (+31.6% y/y). Also lower were motor vehicle
& parts orders. The 1.6% (+4.9% y/y) drop was the third consecutive
month of sharp decline. Less the transportation sector altogether, orders
for durables rose 1.5% (-2.3% y/y) following a 1.7% September
increase; however, there were caveats.
Durable goods orders were unchanged (2.3% y/y) last month after a 9.2%
recovery during September. The figure contrasted with Consensus
expectations for a 1.0% decline. Fewer orders for transportation
equipment accounted for much of the weakness with a 3.1% (+14.4% y/y)
decline. Orders for nondefense aircraft were off 5.8% (+52.7% y/y) while orders
for defense aircraft fell 4.3% (+31.6% y/y). Also lower were motor vehicle
& parts orders. The 1.6% (+4.9% y/y) drop was the third consecutive
month of sharp decline. Less the transportation sector altogether, orders
for durables rose 1.5% (-2.3% y/y) following a 1.7% September
increase; however, there were caveats.
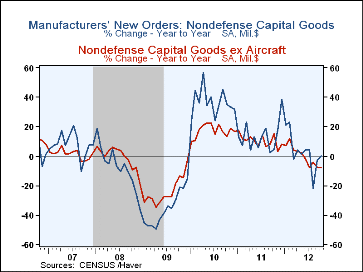
The 4.1% jump in electrical equipment and appliance orders just made up for the September drop and left them down 3.2% y/y. Machinery orders increased 2.9% but remained 9.0% lower versus last year. Also to the upside were orders for computers and electronic products. However, the 0.9% (-8.4% y/y) rise followed five consecutive months of decline. Primary metals exhibited a second month of strength with a 1.7% (3.4% y/y) rise. Nondefense capital goods orders increased 0.8% (0.1% y/y) while excluding aircraft orders gained 1.7% (-8.1% y/y).
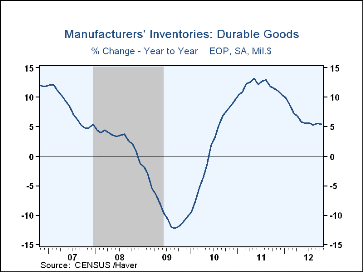
Shipments of durable goods fell 0.6% (+3.3% y/y) and excluding transportation shipments slipped 0.3% (+2.3% y/y). Unfilled orders gained 0.2% (4.4% y/y) while inventories rose 0.4% (5.4% y/y).
The durable goods figures are available in Haver's USECON database. The Action Economics consensus forecast figure is in the AS1REPNA database.
| Durable Goods NAICS Classification | Oct | Sep | Aug | Y/Y | 2011 | 2010 | 2009 |
|---|---|---|---|---|---|---|---|
| New Orders | 0.0 | 9.2 | -13.1 | 2.3 | 9.8 | 27.1 | -30.0 |
| Transportation | -3.1 | 29.7 | -33.7 | 14.4 | 12.8 | 57.4 | -42.0 |
| Total Excluding Transportation | 1.5 | 1.7 | -2.0 | -2.3 | 8.6 | 18.0 | -25.4 |
| Nondefense Capital Goods | 0.8 | 23.0 | -23.9 | 0.1 | 13.2 | 36.3 | -36.9 |
| Excluding Aircraft | 1.7 | -0.4 | 0.3 | -8.1 | 10.3 | 17.1 | -24.5 |
| Shipments | -0.6 | 0.5 | -2.9 | 3.3 | 9.6 | 11.4 | -21.0 |
| Inventories | 0.4 | 0.2 | 0.6 | 5.4 | 10.3 | 9.5 | -10.2 |
| Unfilled Orders | 0.2 | 0.1 | -1.7 | 4.4 | 10.3 | 9.6 | -19.5 |
By Tom Moeller
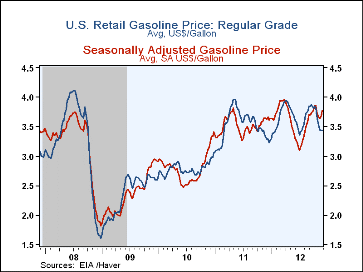
Last week the pump price for a gallon of regular gasoline inched up one cent (3.9%) to $3.44 per gallon. Since their September peak prices have fallen 44 cents per gallon. The w/w price increase ran counter to the norm for this time of year of less driving and lower prices. Haver Analytics constructs seasonal factors to account for seasonal volatility and the adjusted price rose nine cents w/w to $3.78 per gallon. Since their peak last month prices are down just eight cents per gallon.
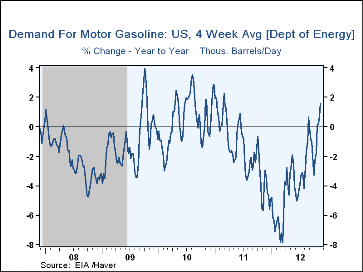
The demand for gasoline jumped 1.6% y/y. Residual fuel oil needs, used for heating, rose by more than one-third y/y but distillate demand declined 9.2% y/y. Lending support to prices was a 4.4% y/y decline in gasoline inventories.
The price for a barrel of light sweet crude oil jumped $1.92 last week to $87.80 per barrel. Yesterday prices were roughly stable at $87.74. Brent crude oil prices increased last week to $110.47 per barrel and were $110.62 yesterday.
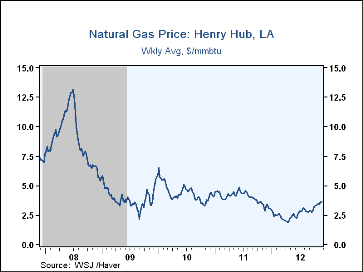
Natural gas prices gained last week to $3.65 per mmbtu and yesterday moved higher to $3.77, the highest level since late September of 2011.
The energy price data are reported by the U.S. Department of Energy and can be found in Haver's WEEKLY database. The daily figures are in DAILY and the gasoline demand figures are in OILWKLY.

| Weekly Price | 11/26/12 | 11/19/12 | 11/12/12 | Y/Y% | 2011 | 2010 | 2009 |
|---|---|---|---|---|---|---|---|
| Retail Regular Gasoline ($ per Gallon, Regular) | 3.44 | 3.43 | 3.45 | 3.9 | 3.52 | 2.78 | 2.35 |
| Light Sweet Crude Oil, WTI ($ per bbl.) | 87.80 | 85.88 | 85.99 | -9.7 | 95.14 | 79.51 | 61.39 |
| Natural Gas ($/mmbtu) | 3.65 | 3.56 | 3.39 | 28.3 | 3.99 | 4.40 | 3.95 |
By Tom Moeller
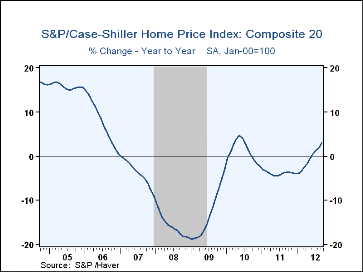
Not only are housing prices rising, but the rate of increase is firming. The seasonally adjusted Case-Shiller 20 City Home Price Index rose 0.4% (3.0% y/y) during September, the same as in August. The y/y gain of 3.0% was the fastest rate of increase since early 2010 and followed last year's 3.9% drop. The narrower 10 City Composite Home Price Index increased 0.3% (2.1% y/y), the eighth rise in as many months.
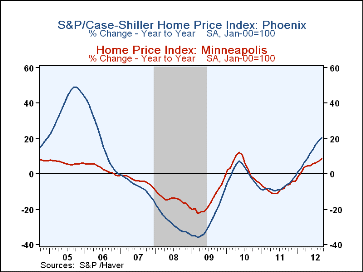
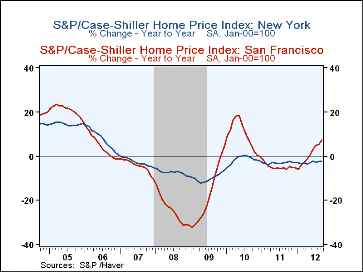
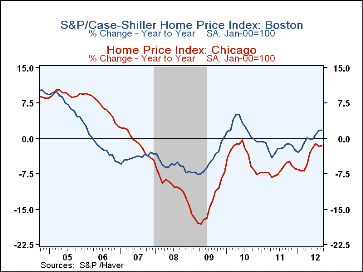
Prices improved m/m during September across the country, notably in Atlanta, San Diego, Phoenix, Los Vegas, Dallas, Denver, Minneapolis and San Francisco. The strongest y/y price momentum was logged in Phoenix, Minneapolis, Detroit, Miami and San Francisco. Continuing lower y/y were prices in New York and Chicago.
The Case-Shiller home price series is value-weighted, i.e., a greater index weight is assigned to more expensive homes. It is a three-month moving average and is calculated using the "repeat sales method," where the item measured is the price change for a specific house compared to the price for that same house the last time it sold. The nation-wide S&P/Case-Shiller home price indexes can be found in Haver's USECON database, and the city data highlighted below are in the REGIONAL database.
Housing Rebounds, but Forward-Looking Indicators Cause Concern from the Federal Reserve Bank of Dallas can be found here.
| S&P Case-Shiller Home Price Index (SA, %) | Sep | Aug | Jul | Sep Y/Y |
2011 | 2010 | 2009 |
|---|---|---|---|---|---|---|---|
| 20 City Composite Index | 0.4 | 0.4 | 0.3 | 3.0% | -3.9 | 1.3 | -13.3 |
| Regional Indicators | |||||||
| Atlanta | 1.7 | 1.7 | 0.8 | 0.1 | -7.0 | -2.4 | -11.6 |
| Boston | 0.1 | 0.5 | 0.6 | 1.9 | -2.0 | 1.9 | -4.9 |
| Chicago | -0.7 | -0.1 | 0.7 | -1.6 | -6.8 | -3.7 | -14.2 |
| Cleveland | 0.6 | 0.3 | -0.4 | 1.5 | -4.3 | 0.7 | -4.8 |
| Dallas | 1.0 | 0.2 | 0.2 | 4.4 | -2.4 | 0.1 | -2.3 |
| Denver | 1.0 | 0.2 | 0.8 | 5.7 | -2.1 | 0.9 | -2.8 |
| Detroit | 0.4 | 0.5 | 1.3 | 7.6 | 0.0 | -3.4 | -21.3 |
| Las Vegas | 1.1 | 0.8 | 0.5 | 3.8 | -6.5 | -7.7 | -29.8 |
| Los Angeles | 0.8 | 1.0 | 0.5 | 4.0 | -3.4 | 5.3 | -15.4 |
| Miami | 0.3 | 0.4 | 0.6 | 7.4 | -4.9 | -2.1 | -22.0 |
| Minneapolis | 1.0 | 0.4 | 0.8 | 8.8 | -8.2 | 3.2 | -15.7 |
| New York | 0.3 | -0.0 | -0.1 | -2.3 | -3.1 | -1.5 | -9.8 |
| Phoenix | 1.3 | 1.4 | 1.4 | 20.4 | -7.3 | -0.3 | -28.0 |
| Portland | 0.7 | 0.4 | 0.2 | 3.7 | -7.2 | -3.2 | -12.8 |
| San Diego | 1.7 | 0.7 | 0.2 | 4.2 | -4.4 | 7.3 | -13.3 |
| San Francisco | 1.0 | 0.1 | 0.7 | 7.4 | -4.9 | 9.3 | -18.4 |
| Seattle | 0.5 | -0.2 | 0.9 | 4.8 | -6.6 | -3.6 | -14.3 |
| Tampa | 0.0 | 0.2 | 0.0 | 6.0 | -6.6 | -4.0 | -18.8 |
| Washington, D.C. | 0.1 | -0.0 | 0.0 | 3.2 | -0.4 | 4.7 | -10.8 |

Tom Moeller
AuthorMore in Author Profile »Prior to joining Haver Analytics in 2000, Mr. Moeller worked as the Economist at Chancellor Capital Management from 1985 to 1999. There, he developed comprehensive economic forecasts and interpreted economic data for equity and fixed income portfolio managers. Also at Chancellor, Mr. Moeller worked as an equity analyst and was responsible for researching and rating companies in the economically sensitive automobile and housing industries for investment in Chancellor’s equity portfolio. Prior to joining Chancellor, Mr. Moeller was an Economist at Citibank from 1979 to 1984. He also analyzed pricing behavior in the metals industry for the Council on Wage and Price Stability in Washington, D.C. In 1999, Mr. Moeller received the award for most accurate forecast from the Forecasters' Club of New York. From 1990 to 1992 he was President of the New York Association for Business Economists. Mr. Moeller earned an M.B.A. in Finance from Fordham University, where he graduated in 1987. He holds a Bachelor of Arts in Economics from George Washington University.
More Economy in Brief


