 Global| Mar 27 2007
U.S. Consumer Confidence Drops Sharply, But Not Seriously
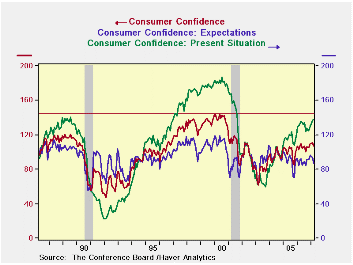
Consumer confidence fell in the current month (March). The drop was fairly sharp to 107.2 from 111.2. But the current conditions index improved to 137.6 from 137.1 while the expectations index crashed and burned dropping to 86.9 from 93.8, hitting its lowest value since August of last year.
The chart on the left sketches out the path of consumer confidence and its two components over the past two business cycles. We add a horizontal line showing that current conditions has not yet hit the peak of the cycle that ended in 1990; they are, of course, way below the peak of the past cycle. Expectations have remained contained to a much lower profile than in either of the previous expansions.
But even a quick perusal of this graph reveals that expectations, important as they are, do not tell of the tipping point around recessions. Indeed we have relatively more FALSE signals from weak expectations than from current conditions – although sometimes from both. We see examples in expansion periods of expectations falling, sometimes quite sharply, but with the expansion continuing. The BEST signal of recession is that broad rounded top and fall off in CURRENT CONDITIONS. Presently that signal is not in play. So we continue to regard the ongoing upswing in consumer confidence as a good thing and brush off this month as mere volatility.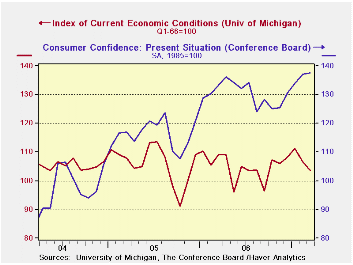
For the moment the signal on current conditions is brighter in the Conference Board report than in the U of M report (see graph on the right). What drives confidence/Sentiment?
We use the table below to help to answer that question and to draw comparisons between the U of M and Conference Board reports.The table presents correlation coefficients between the components on each survey (current conditions and expectations) and relates them to underlying economic variables of interest. You can readily see that the correlations for U of M on current conditions differ from the Conference Board on Current conditions and that current conditions differ from expectations and so on.
| Expectations | ||||||||
| Fed Funds | 10-Year | DJIA | OIL | CPI | Unemployment | Activity | Jobs | |
| Conference Board | 0.311 | 0.082 | 0.370 | -0.120 | -0.295 | -0.535 | 0.089 | 0.286 |
| University of Michigan | 0.311 | -0.035 | 0.434 | -0.245 | -0.404 | -0.670 | 0.099 | 0.344 |
| Current Conditions/Present Situation | ||||||||
| Fed Funds | 10-Year | DIJA | OIL | CPI | Unemployment | Activity | Jobs | |
| Conference Board | 0.533 | -0.171 | 0.650 | 0.086 | -0.181 | -0.958 | -0.016 | 0.370 |
| University of Michigan | 0.428 | -0.108 | 0.472 | 0.012 | -0.233 | -0.779 | 0.146 | 0.146 |
| Correlations on contemporaneous readings: activity is Real Retail Sales & IP over 3-mos | ||||||||
| · What is more interesting is that we have ranked the importance of each factor across Confidence components and found that the ranking of the various effects – the ordering of the importance - is much the same for expectations in the Conference Board and the U of M frame works. With rank correlation of 0.93 (1.0 is perfect correlation) for expectations; the rank correlation for current conditions is 0.84, still relatively high.· The correlations in the table above refers to data since the end of the 1991 recession, encompassing nearly 200 observations.· Beyond the rough similarity in the U of M and Conference Board component rankings in their respective reactions to key economic factors we find: For expectations:
· We also take the Conference Board responses and turn them into diffusion indexes as in the table below. Moreover, for each of these sub-readings there are survey responses as to whether businesses or labor market participants think current conditions or future conditions are ‘good’ ‘bad’ or ‘normal’. We place these readings in their respective range percentiles on observations back to October of 2003. What this does is summarized in the table below: |
|---|
| Mar 07 | Percentile standing | ||||
| Diffusion | Overall | Good | Bad | Normal | |
| Present Situation | 94.8% | ||||
| Business Conditions | 56.7 | 95.3% | 88.9% | 1.5% | 36.1% |
| Employment | 55.7 | 100.0% | 100.0% | 0.0% | 7.6% |
| Expectations | 65.1% | ||||
| Business Conditions | 52.4 | 35.6% | 2.9% | 23.4% | 91.3% |
| Employment | 48.1 | 44.4% | 2.9% | 23.4% | 91.3% |
| Income | 54.7 | 40.0% | 13.5% | 25.7% | 96.6% |
| Buying plans | -- | ||||
| Automobile | 18.8% | ||||
| House | 37.5% | ||||
| Major Appliance | 69.6% | ||||
| Percentile of range since Oct 2003 to date. 100% is High; 0% is Low | |||||
| · Let’s walk you through the values in this table… We conclude that for the present situation business conditions are still expansionary (diffusion at 56.7 >50 (50 is neutral)). The present conditions business situation reading overall is in the 94th percentile of those since Oct 2003 (this refers to the level of the diffusion reading itself, meaning it has been stronger only 6% of the time); it is a relatively high reading. The percentage of respondents seeing conditions as ‘bad’ is in the 1.5 percentile - very low. The percentage of respondents that see things as normal is in the 36 percentile of their range. Current employment responses are the best of the cycle so far (100th percentile). With the most ‘good’ responses and the least ‘bad’ responses. The percentage saying things are normal was in the bottom 8 percent (7.6%) of historic readings. · Expectations are more equivocal. For business conditions, employment and income, ‘bad’ responses out rank ‘good’ responses substantially. BUT, despite that fact, bad responses are generally still in the lower 25% of their respective ranges and ‘Normal’ responses are in the 90-plus percentile. So things are substantially normal with deterioration around the edges. Overall diffusion for the expectations categories is still positive for business conditions and income, but contractionary for jobs (48.1<50) · Buying plans are weak by historic comparison except for appliances.The Regional Picture: | ||||||||||||||||||||||||||||||||||||||||||||||||||||||||||||||||||||||||||||||||||||||||||||||||||||||||||||||||||||||||||||||||||||||||||||||||||||||||||||||||||||||||||||||||||||||||||||||||||||||||||||||||||||||||||||||||||||||||||||||||||||||||||||||||
|---|---|---|---|---|---|---|---|---|---|---|---|---|---|---|---|---|---|---|---|---|---|---|---|---|---|---|---|---|---|---|---|---|---|---|---|---|---|---|---|---|---|---|---|---|---|---|---|---|---|---|---|---|---|---|---|---|---|---|---|---|---|---|---|---|---|---|---|---|---|---|---|---|---|---|---|---|---|---|---|---|---|---|---|---|---|---|---|---|---|---|---|---|---|---|---|---|---|---|---|---|---|---|---|---|---|---|---|---|---|---|---|---|---|---|---|---|---|---|---|---|---|---|---|---|---|---|---|---|---|---|---|---|---|---|---|---|---|---|---|---|---|---|---|---|---|---|---|---|---|---|---|---|---|---|---|---|---|---|---|---|---|---|---|---|---|---|---|---|---|---|---|---|---|---|---|---|---|---|---|---|---|---|---|---|---|---|---|---|---|---|---|---|---|---|---|---|---|---|---|---|---|---|---|---|---|---|---|---|---|---|---|---|---|---|---|---|---|---|---|---|---|---|---|---|---|---|---|---|---|---|---|---|---|---|---|---|---|---|---|---|---|---|---|---|---|---|---|---|---|---|---|---|---|---|---|---|
|
Conference Board Consumer Confidence Trends by Region | Regional Confidence from Oct-03 to Jan-07 | % Above | % Below | Mar-07 | Feb-07 | Yr Ago | Recsn-End | Pre-Recsn | Recsn End | Pre Recsn | New England | 90.6 | 111.4 | 85.1 | 84.5 | 132.7 | 7.2% | -31.7% | Mid Atlantic | 91.5 | 94.1 | 95.0 | 81.0 | 115.9 | 13.0% | -21.1% | East North Central | 65.5 | 74.0 | 73.7 | 85.1 | 139.0 | -23.0% | -52.9% | West North Central | 105.8 | 113.7 | 107.8 | 95.5 | 135.5 | 10.8% | -21.9% | South Atlantic | 117.1 | 132.7 | 131.5 | 89.6 | 141.6 | 30.7% | -17.3% | East South Central | 122.2 | 104.5 | 106.7 | 74.9 | 132.1 | 63.2% | -7.5% | West South Central | 130.0 | 130.0 | 125.4 | 97.7 | 137.4 | 33.1% | -5.4% | Mountain | 142.7 | 141.2 | 141.1 | 98.3 | 140.4 | 45.2% | 1.7% | Pacific | 121.5 | 121.6 | 112.8 | 82.4 | 134.0 | 47.5% | -9.3% | Pre-recession is 1998-2000 | Percentage of Regions with confidence improving | Confidence improving | Mar-07 | Feb-07 | Jan-07 | Dec-06 | Nov-06 | Oct-06 | Yr/Yr | MO/MO or as noted | 33.3 | 44.4 | 44.4 | 33.3 | 33.3 | 55.6 | 44.4 | |||||||||||||||||||||||||||||||||||||||||||||||||||||||||||||||||||||||||||||||||||||||||||||||||||||||||||||||||||||||||||||||||||||||||||||||||||||||||||
| Conference Board Consumer Confidence Trends by Region | ||||||||||||||||||||||||||||||||||||||||||||||||||||||||||||||||||||||||||||||||||||||||||||||||||||||||||||||||||||||||||||||||||||||||||||||||||||||||||||||||||||||||||||||||||||||||||||||||||||||||||||||||||||||||||||||||||||||||||||||||||||||||||||||||
| Regional Confidence from Oct-03 to Jan-07 | % Above | % Below | ||||||||||||||||||||||||||||||||||||||||||||||||||||||||||||||||||||||||||||||||||||||||||||||||||||||||||||||||||||||||||||||||||||||||||||||||||||||||||||||||||||||||||||||||||||||||||||||||||||||||||||||||||||||||||||||||||||||||||||||||||||||||||||||
| Mar-07 | Feb-07 | Yr Ago | Recsn-End | Pre-Recsn | Recsn End | Pre Recsn | ||||||||||||||||||||||||||||||||||||||||||||||||||||||||||||||||||||||||||||||||||||||||||||||||||||||||||||||||||||||||||||||||||||||||||||||||||||||||||||||||||||||||||||||||||||||||||||||||||||||||||||||||||||||||||||||||||||||||||||||||||||||||||
| New England | 90.6 | 111.4 | 85.1 | 84.5 | 132.7 | 7.2% | -31.7% | |||||||||||||||||||||||||||||||||||||||||||||||||||||||||||||||||||||||||||||||||||||||||||||||||||||||||||||||||||||||||||||||||||||||||||||||||||||||||||||||||||||||||||||||||||||||||||||||||||||||||||||||||||||||||||||||||||||||||||||||||||||||||
| Mid Atlantic | 91.5 | 94.1 | 95.0 | 81.0 | 115.9 | 13.0% | -21.1% | |||||||||||||||||||||||||||||||||||||||||||||||||||||||||||||||||||||||||||||||||||||||||||||||||||||||||||||||||||||||||||||||||||||||||||||||||||||||||||||||||||||||||||||||||||||||||||||||||||||||||||||||||||||||||||||||||||||||||||||||||||||||||
| East North Central | 65.5 | 74.0 | 73.7 | 85.1 | 139.0 | -23.0% | -52.9% | |||||||||||||||||||||||||||||||||||||||||||||||||||||||||||||||||||||||||||||||||||||||||||||||||||||||||||||||||||||||||||||||||||||||||||||||||||||||||||||||||||||||||||||||||||||||||||||||||||||||||||||||||||||||||||||||||||||||||||||||||||||||||
| West North Central | 105.8 | 113.7 | 107.8 | 95.5 | 135.5 | 10.8% | -21.9% | |||||||||||||||||||||||||||||||||||||||||||||||||||||||||||||||||||||||||||||||||||||||||||||||||||||||||||||||||||||||||||||||||||||||||||||||||||||||||||||||||||||||||||||||||||||||||||||||||||||||||||||||||||||||||||||||||||||||||||||||||||||||||
| South Atlantic | 117.1 | 132.7 | 131.5 | 89.6 | 141.6 | 30.7% | -17.3% | |||||||||||||||||||||||||||||||||||||||||||||||||||||||||||||||||||||||||||||||||||||||||||||||||||||||||||||||||||||||||||||||||||||||||||||||||||||||||||||||||||||||||||||||||||||||||||||||||||||||||||||||||||||||||||||||||||||||||||||||||||||||||
| East South Central | 122.2 | 104.5 | 106.7 | 74.9 | 132.1 | 63.2% | -7.5% | |||||||||||||||||||||||||||||||||||||||||||||||||||||||||||||||||||||||||||||||||||||||||||||||||||||||||||||||||||||||||||||||||||||||||||||||||||||||||||||||||||||||||||||||||||||||||||||||||||||||||||||||||||||||||||||||||||||||||||||||||||||||||
| West South Central | 130.0 | 130.0 | 125.4 | 97.7 | 137.4 | 33.1% | -5.4% | |||||||||||||||||||||||||||||||||||||||||||||||||||||||||||||||||||||||||||||||||||||||||||||||||||||||||||||||||||||||||||||||||||||||||||||||||||||||||||||||||||||||||||||||||||||||||||||||||||||||||||||||||||||||||||||||||||||||||||||||||||||||||
| Mountain | 142.7 | 141.2 | 141.1 | 98.3 | 140.4 | 45.2% | 1.7% | |||||||||||||||||||||||||||||||||||||||||||||||||||||||||||||||||||||||||||||||||||||||||||||||||||||||||||||||||||||||||||||||||||||||||||||||||||||||||||||||||||||||||||||||||||||||||||||||||||||||||||||||||||||||||||||||||||||||||||||||||||||||||
| Pacific | 121.5 | 121.6 | 112.8 | 82.4 | 134.0 | 47.5% | -9.3% | |||||||||||||||||||||||||||||||||||||||||||||||||||||||||||||||||||||||||||||||||||||||||||||||||||||||||||||||||||||||||||||||||||||||||||||||||||||||||||||||||||||||||||||||||||||||||||||||||||||||||||||||||||||||||||||||||||||||||||||||||||||||||
| Pre-recession is 1998-2000 | ||||||||||||||||||||||||||||||||||||||||||||||||||||||||||||||||||||||||||||||||||||||||||||||||||||||||||||||||||||||||||||||||||||||||||||||||||||||||||||||||||||||||||||||||||||||||||||||||||||||||||||||||||||||||||||||||||||||||||||||||||||||||||||||||
| Percentage of Regions with confidence improving | ||||||||||||||||||||||||||||||||||||||||||||||||||||||||||||||||||||||||||||||||||||||||||||||||||||||||||||||||||||||||||||||||||||||||||||||||||||||||||||||||||||||||||||||||||||||||||||||||||||||||||||||||||||||||||||||||||||||||||||||||||||||||||||||||
| Confidence improving | Mar-07 | Feb-07 | Jan-07 | Dec-06 | Nov-06 | Oct-06 | Yr/Yr | |||||||||||||||||||||||||||||||||||||||||||||||||||||||||||||||||||||||||||||||||||||||||||||||||||||||||||||||||||||||||||||||||||||||||||||||||||||||||||||||||||||||||||||||||||||||||||||||||||||||||||||||||||||||||||||||||||||||||||||||||||||||||
| MO/MO or as noted | 33.3 | 44.4 | 44.4 | 33.3 | 33.3 | 55.6 | 44.4 | |||||||||||||||||||||||||||||||||||||||||||||||||||||||||||||||||||||||||||||||||||||||||||||||||||||||||||||||||||||||||||||||||||||||||||||||||||||||||||||||||||||||||||||||||||||||||||||||||||||||||||||||||||||||||||||||||||||||||||||||||||||||||
| · Regionally there is more evidence of slippage. This month the diffusion reading tells us that there was month-to-month improvement in only 33% of the regions. Year-over-year, only 44% of the regions have stronger confidence today than one year ago. We know that current conditions have done relatively better than expectations. Overall, the present situation is better year-over-year by 2.5% while expectations are lower by 3.8%. · The Consumer Confidence report shows us some irregularities in the economy. Certainly expectations are having a hard time coming to grips with the stock market turbulence, stubborn inflation and higher oil/gas prices. But for the present situation the more powerful draw of low unemployment, ongoing job gains and past stock market gains have underpinned a solid reading. It seems clear that the economy is still fighting off some stress, but also that conditions may be better than what the expectations index is telling us. At this point in the cycle current conditions readings matter more. · When both expectations and current conditions slip together and current conditions form that round shouldered drop – we will worry. | ||||||||||||||||||||||||||||||||||||||||||||||||||||||||||||||||||||||||||||||||||||||||||||||||||||||||||||||||||||||||||||||||||||||||||||||||||||||||||||||||||||||||||||||||||||||||||||||||||||||||||||||||||||||||||||||||||||||||||||||||||||||||||||||||
| Regional Confidence from Oct-03 to Jan-07 | % Above | % Below | |||||
| Mar-07 | Feb-07 | Yr Ago | Recsn-End | Pre-Recsn | Recsn End | Pre Recsn | |
| New England | 90.6 | 111.4 | 85.1 | 84.5 | 132.7 | 7.2% | -31.7% |
| Mid Atlantic | 91.5 | 94.1 | 95.0 | 81.0 | 115.9 | 13.0% | -21.1% |
| East North Central | 65.5 | 74.0 | 73.7 | 85.1 | 139.0 | -23.0% | -52.9% |
| West North Central | 105.8 | 113.7 | 107.8 | 95.5 | 135.5 | 10.8% | -21.9% |
| South Atlantic | 117.1 | 132.7 | 131.5 | 89.6 | 141.6 | 30.7% | -17.3% |
| East South Central | 122.2 | 104.5 | 106.7 | 74.9 | 132.1 | 63.2% | -7.5% |
| West South Central | 130.0 | 130.0 | 125.4 | 97.7 | 137.4 | 33.1% | -5.4% |
| Mountain | 142.7 | 141.2 | 141.1 | 98.3 | 140.4 | 45.2% | 1.7% |
| Pacific | 121.5 | 121.6 | 112.8 | 82.4 | 134.0 | 47.5% | -9.3% |
| Pre-recession is 1998-2000 | |||||||
| Percentage of Regions with confidence improving | |||||||
| Confidence improving | Mar-07 | Feb-07 | Jan-07 | Dec-06 | Nov-06 | Oct-06 | Yr/Yr |
| MO/MO or as noted | 33.3 | 44.4 | 44.4 | 33.3 | 33.3 | 55.6 | 44.4 |

Robert Brusca
AuthorMore in Author Profile »Robert A. Brusca is Chief Economist of Fact and Opinion Economics, a consulting firm he founded in Manhattan. He has been an economist on Wall Street for over 25 years. He has visited central banking and large institutional clients in over 30 countries in his career as an economist. Mr. Brusca was a Divisional Research Chief at the Federal Reserve Bank of NY (Chief of the International Financial markets Division), a Fed Watcher at Irving Trust and Chief Economist at Nikko Securities International. He is widely quoted and appears in various media. Mr. Brusca holds an MA and Ph.D. in economics from Michigan State University and a BA in Economics from the University of Michigan. His research pursues his strong interests in non aligned policy economics as well as international economics. FAO Economics’ research targets investors to assist them in making better investment decisions in stocks, bonds and in a variety of international assets. The company does not manage money and has no conflicts in giving economic advice.
More Economy in Brief


