 Global| Jan 07 2008
U.S. Construction Spending Up Slightly in November
by:Tom Moeller
|in:Economy in Brief
Summary
The value of construction put in place rose slightly in November by 0.1%. That followed a 0.4% October decline which was softer than the 0.8% drop reported initially. The revision was due to a rise in nonresidential building instead [...]
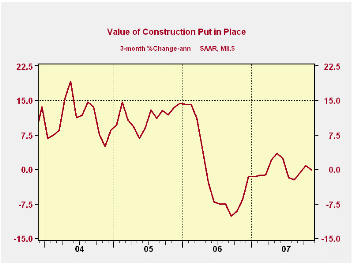
The value of construction put in place rose slightly in November by 0.1%. That followed a 0.4% October decline which was softer than the 0.8% drop reported initially. The revision was due to a rise in nonresidential building instead of the decline indicated last month. The three month growth in total construction activity remained at a stable at -0.1% (AR), an improvement from the 2.3% rate of decline last Autumn.
In November, residential building continued lower. The 2.4% m/m decline was the largest of the current down cycle and it dropped the three month change to -24.4% (AR). Building of new single family units fell 5.0% m/m (-41.2%, three month, AR) and spending on improvements gained 0.7% (6.7%, three month, AR).
During the last twenty years there has been an 84% correlation
between the q/q change in the value of residential building and its
contribution to growth in real GDP.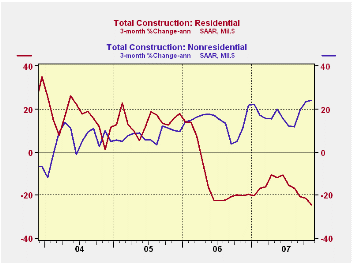
Nonresidential building continued strong and produced a 1.7% rise after a increase 1.2% during the month prior. Three month growth remained quite firm at 24.4% (AR) due to a 37.2% three month rise in office construction and a 21.7% rise in multi-retail building. Commercial construction got back in the upside act with a 12.1% three month gain and educational facility building rose 34.2%.
A 2.5% November rise in public construction spending raised the three month growth rate to 22.2%. Construction on highways & streets rose 32.1% (AR) on a three month basis. The value of construction on highways & streets is nearly one third of the value of total public construction spending. Construction spending on educational facilities again was strong with a 19.1% three month rise.
These more detailed categories represent the Census Bureau’s reclassification of construction activity into end-use groups. Finer detail is available for many of the categories; for instance, commercial construction is shown for Automotive sales and parking facilities, drugstores, building supply stores, and both commercial warehouses and mini-storage facilities. Note that start dates vary for some seasonally adjusted line items in 2000 and 2002 and that constant-dollar data are no longer computed.
Recent and Prospective Developments in Monetary
Policy Transparency and Communications: A Global Perspective is
today's speech by Fed Vice ChairmanDonald L. Kohn at the National
Association for Business Economics Annual Meeting in New Orleans,
Louisiana and is available here.
| November | October | Y/Y | 2006 | 2005 | 2004 | |
|---|---|---|---|---|---|---|
| Total | 0.1% | -0.4% | -0.1% | 5.6% | 10.7% | 11.0% |
| Private | -0.7% | -0.9% | -4.8% | 4.7% | 12.0% | 13.8% |
| Residential | -2.4% | -2.3% | -17.8% | 0.5% | 13.7% | 18.7% |
| Nonresidential | 1.7% | 1.2% | 19.5% | 15.2% | 7.8% | 3.8% |
| Public | 2.5% | 0.9% | 16.2% | 9.2% | 6.2% | 1.7% |
by Robert Brusca January 7, 2008
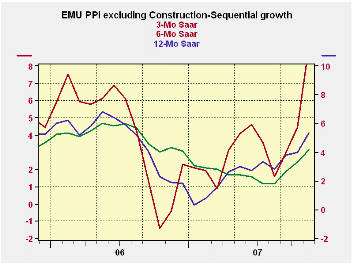
The Euro Area’s past two month’s headline gains for the PPI excluding construction were a sizeable +0.8% and +0.7%, respectively. These are huge increases. On the same period the ex-energy PPI rose by 0.1% and 0.4% a much better pairing - but still not satisfactory for the ECB. While the ECB’s inflation ceiling of 2% applies to the HICP clearly having other indices rising faster than that creates problems for price stability.
At the moment energy prices are pushing headline prices off the map. The 3-mo headline inflation gain of the E-zone PPI is 7.7% up from 4.8% over six months and 4.1% Yr/Yr. All of these figures are excessive. The core rate flattened out at 2.6% over 3-mo and 6-mo lower than the 3.2% it is up Yr/Yr. That is some encouragement but the pace of ex-energy inflation is still excessive.
Still, across countries problems linger. Excl energy inflation in Germany is decelerating, true. But in Italy and in the UK excl energy inflation is higher over three months than it was over six months. It is no wonder that the ECB continues to rattle its saber over inflation.
| Euro Area and UK PPI Trends | ||||||
|---|---|---|---|---|---|---|
| M/M | Saar | |||||
| Ezone-13 | Nov-07 | Oct-07 | 3-Mo | 6-MO | Yr/Yr | Y/Y Yr Ago |
| Total excl Construction | 0.8% | 0.7% | 7.7% | 4.8% | 4.1% | 4.3% |
| Excl Energy | 0.1% | 0.4% | 2.6% | 2.6% | 3.2% | 3.5% |
| Capital Goods | 0.0% | 0.1% | 1.0% | 0.9% | 1.5% | 1.8% |
| Consumer Goods | 0.3% | 0.5% | 5.2% | 5.0% | 3.6% | 1.6% |
| Intermediate & Capital Goods | 0.0% | 0.3% | 1.3% | 1.3% | 2.8% | 4.5% |
| Energy | 3.2% | 1.8% | 26.9% | 12.3% | 7.8% | 6.8% |
| MFG | 0.7% | 0.5% | 6.9% | 4.7% | 4.8% | 2.9% |
| Germany | 0.8% | 0.4% | 5.8% | 3.2% | 2.5% | 4.7% |
| Total excl Energy | -0.1% | 0.4% | 1.4% | 1.8% | 2.3% | 2.9% |
| Italy | 0.9% | 0.5% | 7.8% | 5.2% | 4.6% | 5.3% |
| Total excl Energy | 0.2% | 0.3% | 2.4% | 2.2% | 3.2% | 4.2% |
| UK | 2.2% | 1.9% | 22.6% | 13.2% | 3.1% | 2.6% |
| Total excl Energy | 0.1% | 0.4% | 3.2% | 2.9% | 3.2% | 3.3% |
| E-zone 13 Harmonized PPI excluding Construction | ||||||
| The EA 13 countries are Austria, Belgium, Finland, France, Germany, Greece, Ireland, Italy, Luxembourg, the Netherlands, Portugal, Slovenia | ||||||
by Louise Curley January 7, 2087
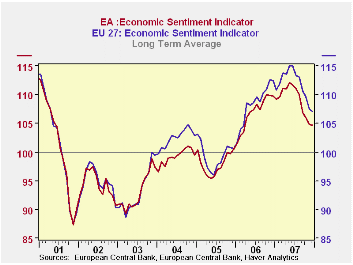
With the price of oil and the euro continuing to climb and financial markets continuing to be unsettled, it is not surprising that economic sentiment among Europeans continues to weaken. For the 27 countries in the European Union, the Economic Sentiment Indicator (ESI) fell 0.4% from 107.5 in November to 107.1 in December and was 4.7% below December, 2006. For the 13 countries in the Euro Area, the ESI fell only 0.1% in December to 104.7 from 104.8 in November (actually less than the consensus estimate) and was 4.6% below December 2006.
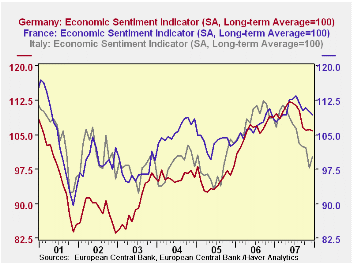
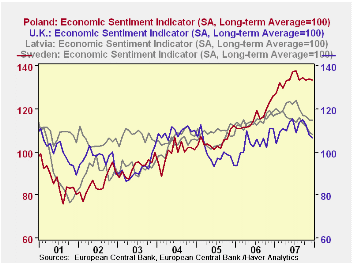
Although there are measures of economic sentiment for the EU 27 and the EA13, it is not possible to derive measures for the non EA as whole. However since sentiment in the EU 27 has generally been higher than that in the EA13, (as can be seen in the first chart) it can be inferred that sentiment in, at least, some of the non EA countries has been higher than those in the EA. The second chart showing selected countries in the EA--France, Germany and Italy--and the third chart, selected countries in the non EA--Sweden, United Kingdom, Poland and Latvia illustrate the point.
| Economic Sentiment Indicators (Long Term Average =100) | Dec 07 | Nov 07 | Dec 06 | M/M %Chg | Y/Y %Chg | 2007 | 2006 | 2005 |
|---|---|---|---|---|---|---|---|---|
| EU 27 | 107.1 | 107.5 | 112.4 | -0.37 | -4.72 | 111.8 | 108.3 | 99.4 |
| EA 13 | 104.7 | 104.8 | 109.8 | -0.10 | -4.62 | 109.0 | 106.9 | 97.9 |
| Germany | 105.9 | 106.2 | 108.8 | -0.28 | -2.67 | 109.2 | 105.9 | 95.1 |
| France | 109.3 | 110.2 | 108.6 | -0.82 | 0.64 | 110.6 | 106.9 | 103.2 |
| Italy | 100.2 | 97.9 | 108.9 | 2.35 | -8.79 | 105.6 | 108.6 | 97.9 |
| United Kingdom | 106.6 | 107.8 | 110.8 | -1.11 | -3.79 | 110.7 | 107.0 | 99.7 |
| Sweden | 114.8 | 114.6 | 116.8 | 0.17 | -1.71 | 119.3 | 114.2 | 105.3 |
| Poland | 133.4 | 134.0 | 126.2 | -0.45 | 5.71 | 133.3 | 116.0 | 105.0 |
| Latvia | 108.1 | 109.2 | 118.9 | -1.01 | -9.08 | 114.8 | 114.7 | 109.7 |
Tom Moeller
AuthorMore in Author Profile »Prior to joining Haver Analytics in 2000, Mr. Moeller worked as the Economist at Chancellor Capital Management from 1985 to 1999. There, he developed comprehensive economic forecasts and interpreted economic data for equity and fixed income portfolio managers. Also at Chancellor, Mr. Moeller worked as an equity analyst and was responsible for researching and rating companies in the economically sensitive automobile and housing industries for investment in Chancellor’s equity portfolio. Prior to joining Chancellor, Mr. Moeller was an Economist at Citibank from 1979 to 1984. He also analyzed pricing behavior in the metals industry for the Council on Wage and Price Stability in Washington, D.C. In 1999, Mr. Moeller received the award for most accurate forecast from the Forecasters' Club of New York. From 1990 to 1992 he was President of the New York Association for Business Economists. Mr. Moeller earned an M.B.A. in Finance from Fordham University, where he graduated in 1987. He holds a Bachelor of Arts in Economics from George Washington University.
More Economy in Brief
 Global| Feb 05 2026
Charts of the Week: Balanced Policy, Resilient Data and AI Narratives
by:Andrew Cates


