 Global| Sep 05 2006
U.S. Construction Spending Drop Largest Since 2001
by:Tom Moeller
|in:Economy in Brief
Summary
In July, the value of construction put in place dropped 1.2% following a little revised 0.4% gain during June. Consensus expectations had been for a 0.1% decline. The m/m drop was the largest since July 2001 and lowered the opening [...]
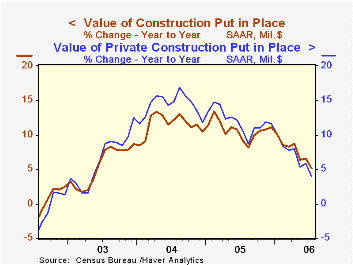
In July, the value of construction put in place dropped 1.2% following a little revised 0.4% gain during June. Consensus expectations had been for a 0.1% decline. The m/m drop was the largest since July 2001 and lowered the opening level for 3Q spending 1.0% below the 2Q average.
The 2.0% July drop in residential building activity was an accelerated rate of decline versus the 1.0% to 1.6% range of monthly shortfalls during the prior three months. New single family building collapsed 3.0% (-6.0% y/y) and the July level was down 9.9% from the peak in February. Moving in the other direction, spending on multi-family projects rose 1.6% (14.9% y/y) but the value of spending on improvements fell 0.8% (-0.2% y/y).
During the last twenty years there has been an 84% correlation between the q/q change in the value of residential building and its contribution to growth in real GDP. During April and May the value of residential building activity was down 1.3% from the 1Q average.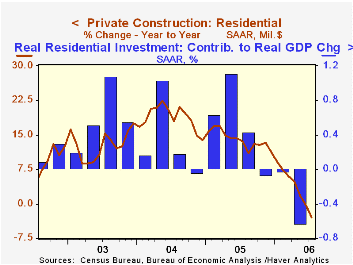
Nonresidential building ticked up 0.3% following strong monthly gains which have now lifted spending by roughly one quarter since the low last year. Office construction surged 5.5% (29.3% y/y) while multi-retail building increased another 3.0% (38.6% y/y). Building by the factory sector fell 3.1% (+26.3% y/y).
Public construction spending fell 0.7%. Construction activity on highways & streets, nearly one third of the value of public construction spending, fell by 0.6% (+18.2% y/y), the second consecutive monthly decline.
These more detailed categories represent the Census Bureau’s reclassification of construction activity into end-use groups. Finer detail is available for many of the categories; for instance, commercial construction is shown for Automotive sales and parking facilities, drugstores, building supply stores, and both commercial warehouses and mini-storage facilities. Note that start dates vary for some seasonally adjusted line items in 2000 and 2002 and that constant-dollar data are no longer computed.
Recent Trends in Homeownership from the Federal Reserve Bank of St. Louis can be found here.
| Construction Put-in-place | July | June | Y/Y | 2005 | 2004 | 2003 |
|---|---|---|---|---|---|---|
| Total | -1.2% | 0.4% | 5.1% | 10.7% | 11.5% | 5.6% |
| Private | -1.3% | 0.4% | 4.0% | 12.0% | 14.3% | 6.4% |
| Residential | -2.0% | -1.0% | 3.0% | 13.9% | 18.6% | 12.8% |
| Nonresidential | 0.3% | 3.7% | 22.0% | 7.4% | 5.3% | -4.8% |
| Public | -0.7% | 0.4% | 9.5% | 6.2% | 2.8% | 2.9% |
by Tom Moeller September 5, 2006
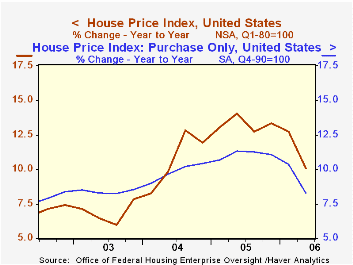
The Office of Federal Housing Enterprise Oversight (OFHEO) reported that during 2Q '06, home prices rose 1.2% q/q and that it was the slowest gain since 4Q '99.
The OFHEO house price index is a geometric weighted average based on more than 26.5 million repeat transactions (purchase or refinance) over 29 years and 12,000 transactions annually.
Year to year, the 10.1% gain in prices nationwide also represented slower growth, the slowest in nearly two years.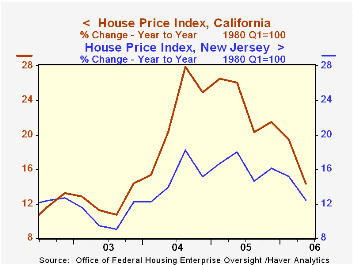
The purchase only home price index rose just 1.2% (8.3% y/y), its slowest quarterly gain since 1997.
The Middle Atlantic (11.0% y/y) and the South Atlantic (13.7% y/y) regions of the country along with the Mountain (14.1% y/y) and the Pacific (14.1% y/y) regions continued to experience firm y/y home price gains, double & triple the rates of appreciation elsewhere in the country.
Slower growth in home prices y/y ranged across the country but prices declined 0.4% q/q in Massachusetts (+3.4% y/y). Prices also fell 0.7% q/q in Michigan (+1.0% y/y) and very slightly in Ohio (+2.1% y/y).
In New York, house prices rose a modest 0.9% (9.9% y/y) and in California prices increased 1.2% (14.3% y/y), a slowdown from the 28.0% y/y gain in late 2004.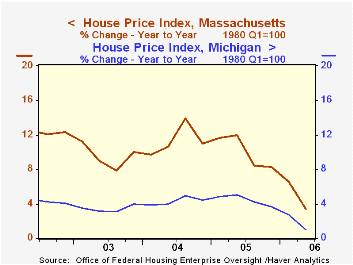
House price appreciation continued strong in Florida as evidenced by a 2.5% q/q gain (21.3% y/y). Last year prices in Florida rose 25.9% and in 2004 were up 17.0%.In New Jersey prices also were firm and rose 1.9% (12.4% y/y).
View the latest OFHEO release here.
What Happens to Banks When House Prices Fall? U.S. Regional Housing Busts of the 1980s and 1990s from the Federal Reserve Bank of St. Louis is available here.
| OFHEO | 2Q '06 | 1Q '06 | Y/Y | 2005 | 2004 | 2003 |
|---|---|---|---|---|---|---|
| House Price Index | 1.2% | 2.2% | 10.1% | 13.3% | 10.8% | 6.9% |
by Tom Moeller September 5, 2006

Announced job cuts in August, reported by Challenger, Grey & Christmas, reversed nearly all of a whopping July decline. The 28,100 increase to 65,278 pulled the three month moving average up 7.3% but it was still 40.4% than last year.
During the last ten years there has been an 83% (inverse) correlation between the three month moving average level of announced job cuts and the three month change payroll employment.
Layoffs rose sharply m/m in the automotive (83.9% y/y), consumer goods (42.2% y/y), electronics (-72.9% y/y), and retail (107.0 % y/y) industries but fell in financial (-21.3% y/y), services (-73.3% y/y) and telecommunications (-77.3% y/y).
Job cut announcements differ from layoffs. Many are achieved through attrition, early retirement or just never occur.
Challenger also reported that announced hiring plans dropped sharply m/m (-73.6% y/y).
Remarks by Fed Chairman Ben S. Bernanke in South Carolina on Friday can be found here.
| Challenger, Gray & Christmas | August | July | Y/Y | 2005 | 2004 | 2003 |
|---|---|---|---|---|---|---|
| Announced Job Cuts | 65,278 | 37,178 | -7.5% | 1,072,054 | 1,039,935 | 1,236,426 |
by Louise Curley September 5, 2006
Data on the volume of retail trade in the twelve members of the Euro-zone and the twenty-five members of the European Union are, for the most part, reported on a seasonally unadjusted basis, a working day adjusted basis, which is also unadjusted for seasonality, a seasonally adjusted basis, which includes the working day adjustment and an estimate of the trend. Eurostat highlights the year over year changes in the working day adjusted series and the month to month changes in the seasonally adjusted series.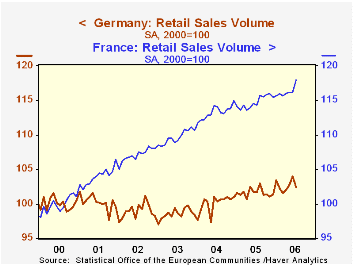
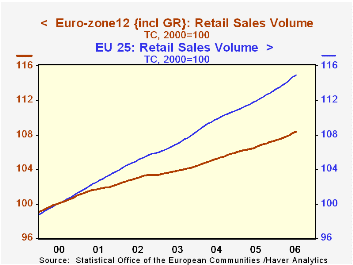
Preliminary data were released today for July. In the Euro-zone, based on partial data (data for Greece, Ireland, Italy, Luxembourg and the Netherlands are not yet available*), the volume of trade was 2.5% above July, 2005 and, on a seasonally adjusted basis, 0.6% above June. 2006. Similar figures for the European Union 25 were 3.3% and 0.3%. In addition to the missing Euro-zone data, data for the Czech Republic, Cyprus, Malta and Hungary are not available**.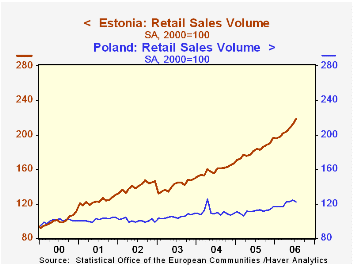
The trends of the volume of trade in the two series are shown in the first chart. The increasing gap between the two series, indicates that the growth in the volume of retail trade in the eastern European countries, the Baltic states, and Denmark, Sweden and the U. K. the European, has, on average, been greater than that of the Euro-zone countries as a whole. Growth in retail trade. however, has varied widely in both the Euro-zone and the non-Euro-zone countries in the European Union. As an example of the different growth rates in the Euro-zone, the second chart compares, the volume of retail trade in France and Germany. In July, 2006, the volume of retail trade in Germany was only 2.4% above the volume in 2000, while the volume in France was 18.0% above the 2000 volume. As an example of the different growth rates in the non Euro-zone countries, the third chart compares the volume of trade in Poland and in Estonia. Although Poland's growth in retail trade is low when compared to that of Estonia, it is within the range of that of France which is one of the faster growth countries in the Euro-zone.
| Volume of Retail Trade (2000=100) | Jul 06 | Jun 06 | Jul 05 | M/M Dif | Y/Y Dif | 2005 | 2004 | 2003 |
|---|---|---|---|---|---|---|---|---|
| France | 118.0 | 116.2 | 114.3 | 1.55 | 3.24 | 114.7 | 113.2 | 109.7 |
| Germany | 102.4 | 104.0 | 101.6 | -1.54 | 0.79 | 101.6 | 100.1 | 98.5 |
| Estonia | 218.5 | 211.9 | 183.4 | 3.11 | 19.14 | 181.84 | 158.98 | 141.34 |
| Poland | 122.2 | 124.3 | 112.1 | -1.69 | 9.01 | 111.59 | 110.24 | 105.14 |
| Euro-zone | 108.8 | 108.1 | 106. | 0.65 | 2.64 | 106.58 | 105.21 | 103.73 |
| European Union | 115.1 | 114.5 | 111.5 | 0.26 | 3.23 | 111.91 | 109.84 | 106.83 |

Tom Moeller
AuthorMore in Author Profile »Prior to joining Haver Analytics in 2000, Mr. Moeller worked as the Economist at Chancellor Capital Management from 1985 to 1999. There, he developed comprehensive economic forecasts and interpreted economic data for equity and fixed income portfolio managers. Also at Chancellor, Mr. Moeller worked as an equity analyst and was responsible for researching and rating companies in the economically sensitive automobile and housing industries for investment in Chancellor’s equity portfolio. Prior to joining Chancellor, Mr. Moeller was an Economist at Citibank from 1979 to 1984. He also analyzed pricing behavior in the metals industry for the Council on Wage and Price Stability in Washington, D.C. In 1999, Mr. Moeller received the award for most accurate forecast from the Forecasters' Club of New York. From 1990 to 1992 he was President of the New York Association for Business Economists. Mr. Moeller earned an M.B.A. in Finance from Fordham University, where he graduated in 1987. He holds a Bachelor of Arts in Economics from George Washington University.
More Economy in Brief


