 Global| Dec 01 2006
U.S. Construction Spending Decline Fifth in Six Months
by:Tom Moeller
|in:Economy in Brief
Summary
During October, the value of construction put in place fell 1.0% after a downwardly revised 0.8% drop in September. It was the fifth decline in the last six months. Consensus expectations had been for a 0.2% dip during October. [...]
During October, the value of construction put in place fell 1.0% after a downwardly revised 0.8% drop in September. It was the fifth decline in the last six months. Consensus expectations had been for a 0.2% dip during October.
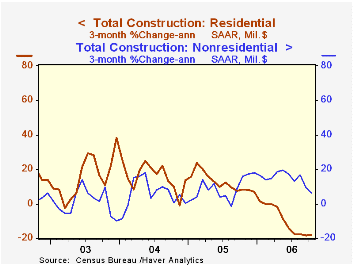
Residential building cratered 1.9%. This seventh consecutive monthly decline lowered the level of construction activity 10.2% below last December's peak. The 3.9% (-17.2% y/y) slide in new single family building was the largest, but only by a little, m/m drop during the last fifteen years. Spending on improvements made up for some that lost work and rose 1.5% (4.9% y/y).
During the last twenty years there has been an 84% correlation between the q/q change in the value of residential building and its contribution to growth in real GDP.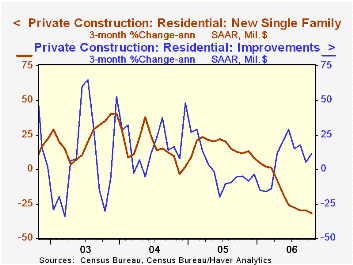
Nonresidential building slipped for the second consecutive month after a downwardly revised 0.6% September decline. The 0.7% October dip was notable for a 3.1% (+13.5% y/y) drop in manufacturing. Office construction also fell 1.6% (+26.7% y/y) but construction in the lodging sector continued to barrel ahead, by 9.0% (68.1% y/y). Multi-retail building also remained firm and posted a 1.3% (35.8% y/y) gain.
Public construction spending increased 0.8% led by a 4.0% (11.3% y/y) jump in transportation spending. Highways & streets, nearly one third of the value of public construction spending, ticked up 0.3% (15.7% y/y).
These more detailed categories represent the Census Bureau’s reclassification of construction activity into end-use groups. Finer detail is available for many of the categories; for instance, commercial construction is shown for Automotive sales and parking facilities, drugstores, building supply stores, and both commercial warehouses and mini-storage facilities. Note that start dates vary for some seasonally adjusted line items in 2000 and 2002 and that constant-dollar data are no longer computed.
| Construction Put-in-place | October | September | Y/Y | 2005 | 2004 | 2003 |
|---|---|---|---|---|---|---|
| Total | -1.0% | -0.8% | 0.5% | 10.7% | 11.5% | 5.6% |
| Private | -1.5% | -1.1% | -2.0% | 12.0% | 14.3% | 6.4% |
| Residential | -1.9% | -1.4% | -9.4% | 13.9% | 18.6% | 12.8% |
| Nonresidential | -0.7% | -0.6% | 16.4% | 7.4% | 5.3% | -4.8% |
| Public | 0.8% | 0.2% | 9.9% | 6.2% | 2.8% | 2.9% |
by Tom Moeller December 1, 2006
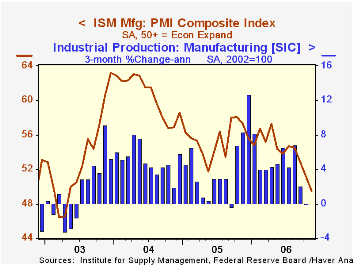
The November composite index of manufacturing activity from the Institute for Supply Management fell to 49.5 from 51.2 the prior month. The decline plopped the index below the break even level of 50 for the first month since April 2003. Consensus expectations had been for stability at 52.0 but the market's expectation was altered by yesterday's weak Chicago PMI report.
During the last ten years there has been a 67% correlation between the level of the ISM index and three month growth in factory sector industrial production.
The new orders component at 48.7 and production at 48.5 led the m/m declines. The new export orders index also fell moderately to 56.9. The series peak was in early 2004 near 60. During the last ten years there has been a 69% correlation between the level of the export order index and the q/q growth in goods exports from the GDP accounts. The imports index also fell slightly.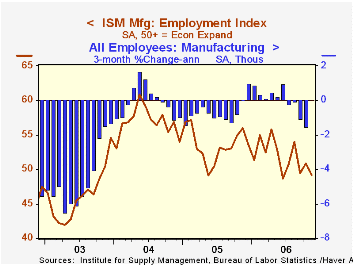
Employment also dropped below the break-even level to 49.2. During the last ten years there has been a 77% correlation between the level of the ISM employment Index and the three month growth in factory sector employment.
A higher vendor deliveries index (52.8) and a higher inventories series (49.7) dampened the decline in the Composite index.
The price index, which is not included in the composite, rose for the first month in the last four.
During the last ten years there has been an 89% correlation between the level of the price index and the three month change in the PPI for intermediate goods less food & energy.
The Long-Run Effects of the Bankruptcy Reform Bill from the Federal Reserve Bank of Philadelphia is available here
| ISM Manufacturing Survey | November | October | Nov. '05 | 2005 | 2004 | 2003 |
|---|---|---|---|---|---|---|
| Composite Index | 49.5 | 51.2 | 57.3 | 55.5 | 60.5 | 53.3 |
| Prices Index (NSA) | 53.5 | 47.0 | 74.0 | 66.4 | 79.8 | 59.6 |
by Carol Stone December 1, 2006
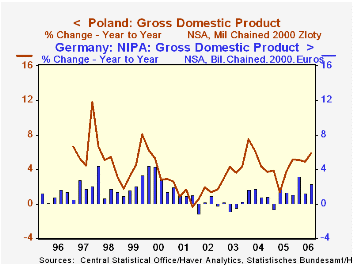
A rebound in capital outlays boosted Poland's GDP in Q3, pushing it ahead 2.8% (quarterly rate) for the quarter and 5.9% from a year ago. GDP had contracted by 1.5% in Q2. Both major sectors, consumption and capital spending, contributed to the Q3 gain.
Final consumption picked up from a modest 0.7% gain in Q2 to 1.5% in Q3. The year-on-year increase was 4.6%, in between Q2's 4.3% and Q1's 5.0%. This puts consumption for the year on a path to show the strongest growth since 1999. 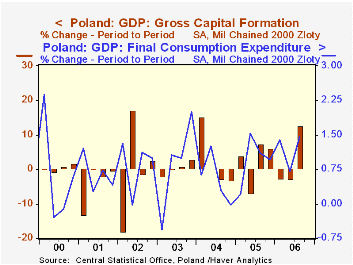
Gross capital formation had declined in Q1 and Q2, but rebounded sharply in Q3. This may be due in part to some recovery in inventory positions; accompanying data we carry from Eurostat indicate these were liquidated in both Q1 and Q2. Even so, this would not likely account for the entire surge in capital outlays, which amounted to PLN5.6 billion, so fixed investment must also be expanding.
The Polish economy, as seen in the first graph, is growing with some vigor, particularly compared with its big neighbor Germany. The expansion in capital investment is a good sign that business is betting that these gains will continue.
| POLAND, Seas Adj*, Bil.Chn.2000 Zlotys | Q3 2006 | Q2 2006 | Q1 2006 | Year Ago | 2005 | 2004 | 2003 |
|---|---|---|---|---|---|---|---|
| Total GDP | 228.9 | 222.8 | 226.1 | 216.1 | 864.7 | 835.1 | 792.8 |
| % Change | 2.8 | -1.5 | 2.6 | 5.9 | 3.5 | 5.4 | 3.8 |
| Final Consumption | 1.5 | 0.7 | 1.4 | 4.6 | 2.6 | 4.0 | 2.5 |
| Gross Capital Formation | 12.6 | -2.8 | -2.7 | 13.0 | 1.4 | 14.7 | 3.3 |

Tom Moeller
AuthorMore in Author Profile »Prior to joining Haver Analytics in 2000, Mr. Moeller worked as the Economist at Chancellor Capital Management from 1985 to 1999. There, he developed comprehensive economic forecasts and interpreted economic data for equity and fixed income portfolio managers. Also at Chancellor, Mr. Moeller worked as an equity analyst and was responsible for researching and rating companies in the economically sensitive automobile and housing industries for investment in Chancellor’s equity portfolio. Prior to joining Chancellor, Mr. Moeller was an Economist at Citibank from 1979 to 1984. He also analyzed pricing behavior in the metals industry for the Council on Wage and Price Stability in Washington, D.C. In 1999, Mr. Moeller received the award for most accurate forecast from the Forecasters' Club of New York. From 1990 to 1992 he was President of the New York Association for Business Economists. Mr. Moeller earned an M.B.A. in Finance from Fordham University, where he graduated in 1987. He holds a Bachelor of Arts in Economics from George Washington University.
More Economy in Brief


