 Global| Dec 01 2009
U.S. Construction Flat In OctoberWith Downward Revisions To Prior Months
by:Tom Moeller
|in:Economy in Brief
Summary
It's the same story as in prior months, only more-so. October construction spending was unchanged after revisions lowered earlier months' activity. September outlays now are reported down 1.6%, double last months' estimate. Consensus [...]
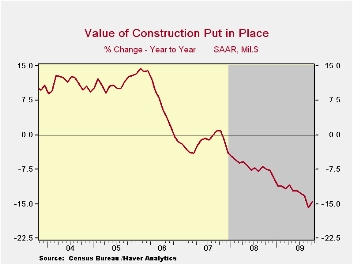 It's the same story as in
prior months, only
more-so. October construction spending was unchanged after revisions
lowered earlier months' activity. September outlays now are reported
down 1.6%, double last months' estimate. Consensus estimates had been
for a slight uptick in October activity.
It's the same story as in
prior months, only
more-so. October construction spending was unchanged after revisions
lowered earlier months' activity. September outlays now are reported
down 1.6%, double last months' estimate. Consensus estimates had been
for a slight uptick in October activity.
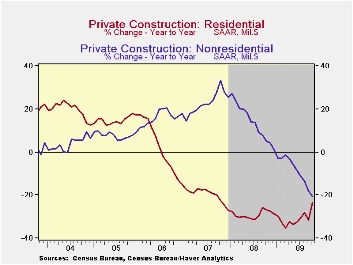 Residential
building activity
did increase 4.4%, but a September gain was revised to a 2.0% decline.
Single-family construction rose 1.9% (-30.7% y/y) for the fifth
consecutive, firm monthly increase. Spending on improvements also
firmed by 8.7% (-7.3% y/y) but September's initially reported 7.2%
increase was revised to a 5.7% decline. Multi-family building continued
down by 2.1% (-43.6% y/y) and was off 55.6% from the January 2007
peak.· Nonresidential building activity fell another 2.5% during
October after a 3.6% September decline that was double the initial
estimate. Since the 2008 peak activity has fallen by 20.6%. Spending in
the food & beverage industry declined 32.5% y/y while
expenditures in the lodging were off by nearly one-half. Commercial
building overall fell 40.0% y/y while office building dropped by more
than one-third. Relatively moderate was the y/y decline in the
education, religious and health care sectors. · Public
construction overall fell a modest 0.4% during October and y/y
expenditures actually rose though tax revenues fell. Building activity
on highways & streets fell just 0.3% m/m (+4.7% y/y) as the
nation's infrastructure received more attention. Public spending on
health care facilities reversed much of the prior month's gain with a
3.2% decline (+12.6% y/y) and building in the education sector rose
1.1% (-0.1% y/y).
Residential
building activity
did increase 4.4%, but a September gain was revised to a 2.0% decline.
Single-family construction rose 1.9% (-30.7% y/y) for the fifth
consecutive, firm monthly increase. Spending on improvements also
firmed by 8.7% (-7.3% y/y) but September's initially reported 7.2%
increase was revised to a 5.7% decline. Multi-family building continued
down by 2.1% (-43.6% y/y) and was off 55.6% from the January 2007
peak.· Nonresidential building activity fell another 2.5% during
October after a 3.6% September decline that was double the initial
estimate. Since the 2008 peak activity has fallen by 20.6%. Spending in
the food & beverage industry declined 32.5% y/y while
expenditures in the lodging were off by nearly one-half. Commercial
building overall fell 40.0% y/y while office building dropped by more
than one-third. Relatively moderate was the y/y decline in the
education, religious and health care sectors. · Public
construction overall fell a modest 0.4% during October and y/y
expenditures actually rose though tax revenues fell. Building activity
on highways & streets fell just 0.3% m/m (+4.7% y/y) as the
nation's infrastructure received more attention. Public spending on
health care facilities reversed much of the prior month's gain with a
3.2% decline (+12.6% y/y) and building in the education sector rose
1.1% (-0.1% y/y).
The construction put-in-place figures are available in Haver's USECON database.
Talking about Tomorrow’s Monetary Policy Today from the Federal Reserve Bank of San Francisco can be found here .
| Construction (%) | October | September | August | Y/Y | 2008 | 2007 | 2006 |
|---|---|---|---|---|---|---|---|
| Total | 0.0 | -1.6 | -0.9 | -14.4 | -6.9 | -1.6 | 6.3 |
| Private | 0.3 | -3.0 | -0.5 | -21.9 | -11.1 | -5.7 | 5.5 |
| Residential | 4.2 | -2.0 | 3.1 | -23.6 | -29.1 | -19.7 | 1.0 |
| Nonresidential | -2.5 | -3.6 | -2.9 | -20.6 | 13.2 | 23.1 | 16.2 |
| Public | -0.4 | 0.9 | -1.7 | 3.8 | 5.6 | 13.1 | 9.3 |
ADP Report: U.S. Payroll Employment Decline Moderates Further
by Tom Moeller December 1, 2009
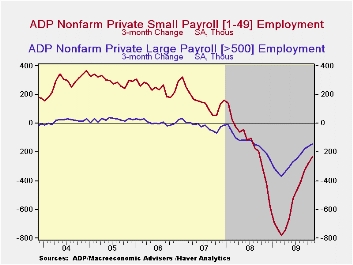
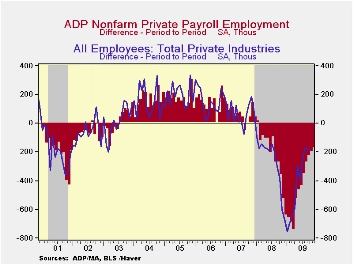 Payroll
employment fell again last month, but the rate of decline slowed
further. The latest report from the payroll processor ADP, in their
National Employment Report, indicated that private nonfarm payrolls
fell 169,000 during November. That followed a revised 195,000 October
decline which was shallower than reported initially. The latest reading
was the twenty-second consecutive monthly decline. The monthly drop,
however, was the smallest decline since July of last year and
three-quarters the size of the worst reading last March. The
three-month annualized rate of decline in payrolls also eased to 2.1%
from its March record of 7.1%.
Payroll
employment fell again last month, but the rate of decline slowed
further. The latest report from the payroll processor ADP, in their
National Employment Report, indicated that private nonfarm payrolls
fell 169,000 during November. That followed a revised 195,000 October
decline which was shallower than reported initially. The latest reading
was the twenty-second consecutive monthly decline. The monthly drop,
however, was the smallest decline since July of last year and
three-quarters the size of the worst reading last March. The
three-month annualized rate of decline in payrolls also eased to 2.1%
from its March record of 7.1%.
 ADP
compiled the estimate from its database of individual companies'
payroll information. Macroeconomic Advisers, LLC, the St. Louis
economic consulting firm, developed the methodology for transforming
the raw data into an economic indicator.
ADP
compiled the estimate from its database of individual companies'
payroll information. Macroeconomic Advisers, LLC, the St. Louis
economic consulting firm, developed the methodology for transforming
the raw data into an economic indicator.
The U.S. Bureau of Labor Statistics will report November payroll employment this Friday. For comparison, the October decline of 195,000 in ADP's measure of private nonfarm payrolls was accompanied by a loss of 190,000 jobs in the BLS measure of private sector payrolls.
According to ADP and Macro-Advisers, the correlation between the monthly percentage change in the ADP estimate and that in the BLS data is 0.90.
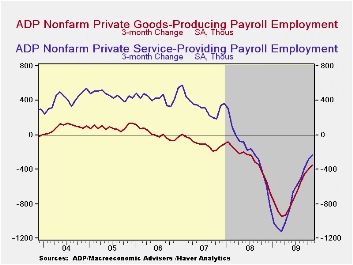
ADP reported that the decline in small-sized payrolls moderated to 68,000 (-4.1% y/y). Medium-sized payrolls fell 57,000 (-5.1% y/y) and large payrolls fell by 44,000 (-5.3% y/y). The decline in service-producing industry employment continued. The November drop of 81,000 (-2.9% y/y) was the twenty-first consecutive monthly decline but in percentage terms the three-month rate of change moderated to -1.1%, less than three-quarters, the worst from January through March. The decline in medium-sized service payrolls amounted to 30,000 (-3.2% y/y) and small-sized payrolls declined 32,000 (-2.6% y/y). Large service producing payrolls decreased 19,000 and the y/y decline eased slightly to -3.2%.
 In the
goods
producing sector employment fell 88,000 during November (-12.6% y/y)
but the October decline was revised shallower. Here, the three-month
rate of decline eased again to -7.3% versus -17.3% at its worst.
Small-sized payrolls fell 36,000 (-12.4% y/y) followed by a 27,000
(-12.6% y/y) drop in medium-sized payrolls. Large payrolls fell 25,000
(-13.0% y/y). In the manufacturing sector alone, payrolls fell 44,000
(-11.8% y/y) but the three-month change moderated to -5.8% from -17.4%
at its worst.
In the
goods
producing sector employment fell 88,000 during November (-12.6% y/y)
but the October decline was revised shallower. Here, the three-month
rate of decline eased again to -7.3% versus -17.3% at its worst.
Small-sized payrolls fell 36,000 (-12.4% y/y) followed by a 27,000
(-12.6% y/y) drop in medium-sized payrolls. Large payrolls fell 25,000
(-13.0% y/y). In the manufacturing sector alone, payrolls fell 44,000
(-11.8% y/y) but the three-month change moderated to -5.8% from -17.4%
at its worst.
The ADP National Employment Report data is maintained in Haver's
USECON database; historical figures date back to December 2000. The figures in this report cover only private sector jobs and exclude employment in the public sector, which rose an average 11,083 during the last twelve months.The full ADP National Employment Report can be found here and the ADP methodology is explained here.
The Estimated Impact of the American Recovery and Reinvestment Act on Employment and Economic Output as of September 2009 from the Congressional Budget Office can be found here.
| ADP National Employment Report | November | October | September | Y/Y | 2008 | 2007 | 2006 |
|---|---|---|---|---|---|---|---|
| Total Nonfarm Private PayrollEmployment (m/m Chg., 000s) | -169 | -195 | -220 | -4.7% | -0.5% | 1.2% | 2.0% |
| Small Payroll (1-49) | -68 | -77 | -88 | -4.1 | -0.0 | 1.6 | 2.2 |
| Medium Payroll (50-499) | -57 | -70 | -78 | -5.1 | -0.5 | 1.2 | 1.9 |
| Large Payroll (>500) | -44 | -48 | -54 | -5.3 | -1.6 | -0.1 | 0.4 |
U.S. Vehicle Sales Move SlightlyHigher During November
by Tom Moeller December 1, 2009
 U.S.
unit sales of light vehicles during November showed
that consumers' interest in making big-ticket purchases is recovering
from the recession lows. Sales rose 4.5% m/m to 10.93M units according
to the Autodata Corporation. November sales were stronger than
Consensus expectations for 10.5M and sales have risen 19.2% from the
February low. (Seasonal adjustment of the figures is provided by the
U.S. Bureau of Economic Analysis).
U.S.
unit sales of light vehicles during November showed
that consumers' interest in making big-ticket purchases is recovering
from the recession lows. Sales rose 4.5% m/m to 10.93M units according
to the Autodata Corporation. November sales were stronger than
Consensus expectations for 10.5M and sales have risen 19.2% from the
February low. (Seasonal adjustment of the figures is provided by the
U.S. Bureau of Economic Analysis).
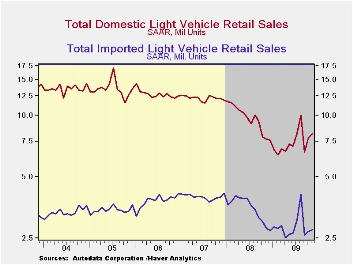
Sales of domestically made vehicles rose 5.4% last month to 8.17M units. They now have recovered 28.2% from the February low. Sales of fuel efficient cars rose 3.7% and have risen 27.9% from the low. Light truck sales increased 6.8% m/m and were 28.4% above the low. · Imported light vehicle sales rose a modest 1.9% to 2.76M but were up 9.7% from the recession low in April. Sales of imported autos inched up 0.6% m/m and 11.2% from the low while imported light truck sales rose 4.8% and 6.7% from the low.
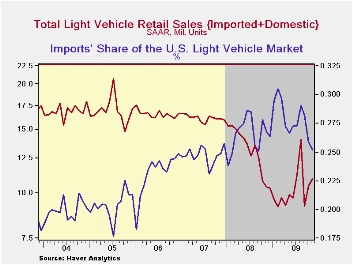
 Overall,
import's share of the U.S. light vehicle market fell to
25.2% last month from 25.9% in October. It reached 26.5% during all of
last year. (Imported vehicles are those produced outside the United
States.) Imports' share of the U.S. car market totaled 33.2% versus
34.3% during all of last year while the share of the light truck market
was 16.7%, down from 18.3% last year.
Overall,
import's share of the U.S. light vehicle market fell to
25.2% last month from 25.9% in October. It reached 26.5% during all of
last year. (Imported vehicles are those produced outside the United
States.) Imports' share of the U.S. car market totaled 33.2% versus
34.3% during all of last year while the share of the light truck market
was 16.7%, down from 18.3% last year.
The U.S. vehicle sales figures can be found in Haver's USECON database.
The price of gasoline and the demand for fuel economy: evidence from monthly new vehicles sales data from the Federal Reserve Bank of Chicago is available here.
| Light Vehicle Sales (SAAR, Mil. Units) | November | October | September | Nov. Y/Y | 2008 | 2007 | 2006 |
|---|---|---|---|---|---|---|---|
| Total | 10.93 | 10.46 | 9.22 | 4.9% | 13.17 | 16.16 | 16.54 |
| Autos | 5.65 | 5.50 | 5.02 | 9.7 | 6.71 | 7.58 | 7.77 |
| Domestic | 3.77 | 3.64 | 3.25 | 12.7 | 4.42 | 5.07 | 5.31 |
| Imported | 1.88 | 1.87 | 1.77 | 4.2 | 2.29 | 2.52 | 2.45 |
| Light Trucks | 5.28 | 4.96 | 4.20 | 0.2 | 6.47 | 8.60 | 8.78 |
| Domestic | 4.40 | 4.12 | 3.37 | 2.6 | 5.29 | 7.10 | 7.42 |
| Imported | 0.88 | 0.84 | 0.83 | -10.3 | 1.18 | 1.47 | 1.37 |
by Robert Brusca December 2, 2009
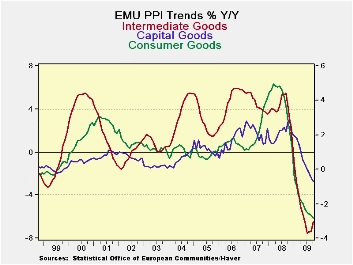
The EMU PPI has turned up in October pushing the three month headline PPI series to an annual rate gain of 4.1%. Main categories (independently seasonally adjusted) all show declines in October while the headline (ex construction) series is up.
Inflation in Germany, France, Italy and the UK rose this month. Only German core PPI inflation fell
Only Germany has persistently declining Inflation as its 3-mo, 6-mo and 12-mo inflation rates all are falling. Even so, German core inflation is showing a steady menu of higher increase across its sequential growth rates and its headline pace, despite dropping, is dropping by less and less as we shorten the horizon for inflation calculation. That means that despite its persistent declines even German headline inflation is seeing upward pressures embedded those ongoing but diminishing declines. French headline and core rates are accelerating as are the headline rates for Italy and the UK. The recent UK inflation result is eye-popping.
On balance the Euro Area has some inflation cooking. It is on simmer but Europe is not Japan and has no deflation problem. For the most part the inflation that is appearing seems to be healthy after a period of extended price declines and in an economy that needs to begin to post some growth in the aftermath of asset price drops. Italy and UK inflation rates are uncomfortably high. But headline inflation is being buffeted by energy prices and may not be indicative of true inflation pressures at all. PPI inflation is notoriously volatile. The ECB looking more closely at the HICP, yet this report will not go unnoticed.
| Euro Area and UK PPI Trends | ||||||
|---|---|---|---|---|---|---|
| M/M | Saar | |||||
| Euro Area | Oct-09 | Sep-09 | 3-Mo | 6-MO | Yr/Yr | Y/Y Yr Ago |
| TotalxConstruct | 0.3% | -0.1% | 4.1% | 0.4% | -6.6% | 6.1% |
| Capital Goods | 0.0% | 0.0% | -0.1% | -0.8% | -0.7% | 2.8% |
| Consumer Goods | -0.3% | -0.1% | -1.1% | -0.8% | -2.8% | 2.8% |
| Intermediate & Capital Goods | -0.1% | 0.5% | 3.3% | 0.5% | -6.5% | 4.1% |
| MFG | 0.3% | 0.0% | 5.2% | 2.4% | -5.2% | 3.6% |
| Germany | 0.2% | -0.2% | -5.2% | -6.1% | -7.5% | 7.8% |
| Gy ExEnergy | -0.3% | 0.1% | 0.4% | -1.0% | -3.2% | 2.4% |
| France:Tot | 1.0% | -0.2% | 6.5% | 2.7% | -6.6% | 4.9% |
| Fr ExF&Energy | 0.3% | 0.0% | 1.5% | -0.4% | -3.4% | 3.3% |
| Italy | 0.3% | 0.3% | 5.9% | 1.2% | -6.1% | 4.7% |
| UK | 1.4% | 0.4% | 19.0% | 8.6% | -2.7% | 14.6% |
| Euro Area Harmonized PPI ex construction | ||||||
by Tom Moeller December 1, 2009
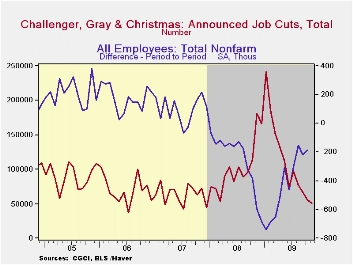 The
outplacement firm of Challenger, Grey & Christmas indicated
that job cut announcements fell last month to 50,349, compared to a
high of 241,748 in January of this year. The latest reading was the
least number of layoffs since December 2007. Layoffs have moderated
sharply in the apparel, consumer goods, financial, retail, services and
transportation industries. They rose sharply in the health care
industry and moderately in the insurance industry.
The
outplacement firm of Challenger, Grey & Christmas indicated
that job cut announcements fell last month to 50,349, compared to a
high of 241,748 in January of this year. The latest reading was the
least number of layoffs since December 2007. Layoffs have moderated
sharply in the apparel, consumer goods, financial, retail, services and
transportation industries. They rose sharply in the health care
industry and moderately in the insurance industry.
During the last ten years there has been a 67% (inverse) correlation between the three- month moving average of announced job cuts and the three-month change payroll employment. Job cut announcements differ from layoffs. Many are achieved through attrition, early retirement or just never occur.
 These
figures are gross layoffs
and do not reflect new hires as do the monthly figures on payroll
employment. At their 2007 low, the latest Challenger figures were then
accompanied by monthly gains in nonfarm payrolls of roughly 160,000.
These
figures are gross layoffs
and do not reflect new hires as do the monthly figures on payroll
employment. At their 2007 low, the latest Challenger figures were then
accompanied by monthly gains in nonfarm payrolls of roughly 160,000.
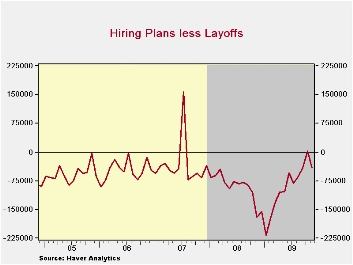
Challenger also provides data on firms' hiring plans. During November plans fell back to the recession lows after having increased over the last two months. The net of hires less layoffs nevertheless was near its least 2007.
The Challenger figures are available in Haver's SURVEYS database.
The Recession in Perspective from the Federal Reserve Bank of Minneapolis can be found here.
| Challenger, Gray & Christmas | November | October | September | Y/Y | 2008 | 2007 | 2006 |
|---|---|---|---|---|---|---|---|
| Announced Job Cuts | 50,349 | 55,679 | 66,404 | -72.3% | 1,223,993 | 768,264 | 839,822 |
| Announced Hiring Plans | 10,076 | 57,520 | 25,047 | -9.7 | 118,600 | 365,583 | 273,887 |

Tom Moeller
AuthorMore in Author Profile »Prior to joining Haver Analytics in 2000, Mr. Moeller worked as the Economist at Chancellor Capital Management from 1985 to 1999. There, he developed comprehensive economic forecasts and interpreted economic data for equity and fixed income portfolio managers. Also at Chancellor, Mr. Moeller worked as an equity analyst and was responsible for researching and rating companies in the economically sensitive automobile and housing industries for investment in Chancellor’s equity portfolio. Prior to joining Chancellor, Mr. Moeller was an Economist at Citibank from 1979 to 1984. He also analyzed pricing behavior in the metals industry for the Council on Wage and Price Stability in Washington, D.C. In 1999, Mr. Moeller received the award for most accurate forecast from the Forecasters' Club of New York. From 1990 to 1992 he was President of the New York Association for Business Economists. Mr. Moeller earned an M.B.A. in Finance from Fordham University, where he graduated in 1987. He holds a Bachelor of Arts in Economics from George Washington University.
More Economy in Brief


