 Global| Jul 23 2009
U.S. Claims For Jobless InsuranceTick Higher Last Week Yet Remain Off Peak
by:Tom Moeller
|in:Economy in Brief
Summary
Positive growth in jobs may not have yet begun, but the rate of job loss has slowed. The Labor Department's report on employment insurance claims indicated a moderate, and expected, 30,000 increase in initial claims. The gain to [...]
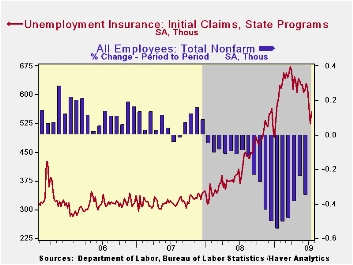
Positive growth in jobs may not have yet begun, but the rate of job loss has slowed. The Labor Department's report on employment insurance claims indicated a moderate, and expected, 30,000 increase in initial claims. The gain to 554,000 only reversed, however, a piece of the cumulative 106,000 drop during the prior three weeks. As a result, the latest level remained near the lowest since early January and it was off from the March peak of 674,000. The four-week average of claims, which smoothes out some of the volatility in the weekly numbers, fell to 566,000 which was its lowest level since late-January.
The latest initial claims figure covers the survey week for July nonfarm payrolls. There was a 58,000 (9.5%) drop from the June survey period. During the last ten years there has been and 86% correlation between the level of initial claims and the m/m change in nonfarm payrolls.
The Labor Department indicated that the largest increases in initial claims for the week ending July 11 were in New York (+12,504), North Carolina (+10,382), Florida (+10,043), Missouri (+8,293), and Tennessee (+6,943), while the largest decreases were in Michigan (-6,648), Massachusetts (-2,910), New Jersey (-2,888), Indiana (-2,497), and California (-1,755).
Confirming the labor market's improvement was an 88,000 drop
in continuing claims for unemployment insurance which added to a
revised 591,000 decline during the prior week. The latest figure was
the lowest level since mid-April. The continuing claims figures lag
initial claims by one week and provide an indication of workers'
ability to find employment. Despite the latest decline, however, the
level of 6,225,000 claims was nearly double the year ago
level. The four-week average of continuing claims fell back
to 6,541,500 which was the lowest since mid-May. The series dates back
to 1966.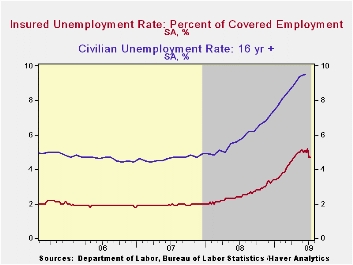
The insured rate of unemployment remained at 4.7% which was the lowest level since mid-April. During the last ten years, there has been a 93% correlation between the level of the insured unemployment rate and the overall rate of unemployment published by the Bureau of Labor Statistics.
The highest insured unemployment rates in the week ending July 4 were in Puerto Rico (6.9 percent), Michigan (6.8), Oregon (6.8), Pennsylvania (6.4), Nevada (6.2), Wisconsin (6.1), South Carolina (5.7), New Jersey (5.6), North Carolina (5.5), and Connecticut (5.4). The lowest rates were in Texas (3.0), Wyoming (3.0), Colorado (3.3), Maine (3.3), Maryland (3.7), Minnesota (4.1), Florida (4.2), Georgia (4.6) and Mississippi (4.5).
The unemployment insurance claims data is available in Haver's WEEKLY database and the state data is in the REGIONW database.
Trends in the Aggregate Labor Force from the Federal Reserve Bank of St. Louis can be found here.
| Unemployment Insurance (000s) | 07/18/09 | 07/11/09 | 07/04/09 | Y/Y | 2008 | 2007 | 2006 |
|---|---|---|---|---|---|---|---|
| Initial Claims | 554 | 524 | 569 | 34.1% | 420 | 321 | 313 |
| Continuing Claims | -- | 6,225 | 6,313 | 96.7% | 3,342 | 2,552 | 2,459 |
| Insured Unemployment Rate (%) | 4.7 | 4.7 | 2.4 | 2.5 | 1.9 | 1.9 |
by Tom Moeller June 23, 2009
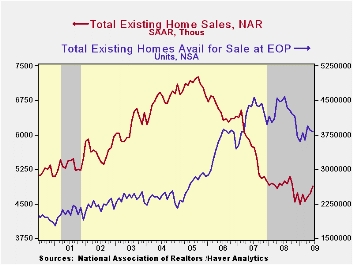
The National Association of Realtors reported that sales of existing homes rose 3.6% from May to the highest level since last October. Recent sales have been helped by a tax credit for first-time home buyers. The latest increase to 4.89M (AR) units beat Consensus expectations for sales of 4.85M homes. Total sales include sales of condos and co-ops. Sales of existing single-family homes alone increased 2.4% last month and they were up 6.7% from the January low. Despite the recent gains, however, sales remained near the lowest level since July 1997. (These data have a longer history than the total sales series).
The recently enacted tax credit is for first-time home buyers of either a new or a pre-owned home. The credit of up to $8,000 extends through the rest of this year. The full details of the home-buyer tax credit can be found here
Home affordability fell somewhat from its record high to the lowest level this year. The decline was the result of the second consecutive, 4%+ m/m increase in home prices to a median $181,800. Nevertheless, affordability remained up by one-third from the year ago level as home prices remained down 20% from the 2007 peak. The series dates back to 1971.
The number of unsold homes (condos & single-family) on
the market fell again, posting a 0.7% decline during June. Year-to-year
inventories are down 14.9%. At the current sales rate there was a 9.4
months' supply on the market which was near the lowest since late-2007.
For single-family homes the inventory was unchanged m/m (-17.9% y/y).
At the current sales rate there was an 8.9 month's supply of homes on
the market, near the lowest since 2007.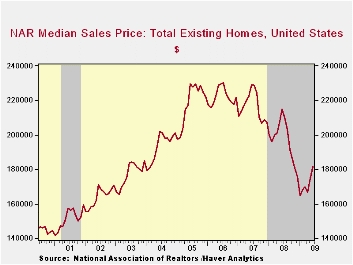
The data on existing home sales, prices and affordability can be found in Haver's USECON database. The regional price, affordability and inventory data is available in the REALTOR database.
What Do We Know (And Not Know) About Potential Output from the Federal Reserve Bank of St. Louis can be found here.
| Existing Home Sales (Thous) | June | May | Y/Y | 2008 | 2007 | 2006 |
|---|---|---|---|---|---|---|
| Total | 4,890 | 4,720 | -0.2% | 4,893 | 5,674 | 6,516 |
| Northeast | 820 | 800 | -4.7 | 845 | 1,010 | 1,093 |
| Midwest | 1,100 | 1,090 | -1.8 | 1,130 | 1,331 | 1,494 |
| South | 1,810 | 1,740 | -3.7 | 1,860 | 2,243 | 2,577 |
| West | 1,160 | 1,090 | 11.5 | 1,064 | 1,095 | 1,357 |
| Single-Family | 4,320 | 4,220 | 0.2 | 4,341 | 4,960 | 5,712 |
| Median Price, Total, $ | 181,800 | 174,700 | -15.4 | 197,250 | 216,633 | 222,042 |

Tom Moeller
AuthorMore in Author Profile »Prior to joining Haver Analytics in 2000, Mr. Moeller worked as the Economist at Chancellor Capital Management from 1985 to 1999. There, he developed comprehensive economic forecasts and interpreted economic data for equity and fixed income portfolio managers. Also at Chancellor, Mr. Moeller worked as an equity analyst and was responsible for researching and rating companies in the economically sensitive automobile and housing industries for investment in Chancellor’s equity portfolio. Prior to joining Chancellor, Mr. Moeller was an Economist at Citibank from 1979 to 1984. He also analyzed pricing behavior in the metals industry for the Council on Wage and Price Stability in Washington, D.C. In 1999, Mr. Moeller received the award for most accurate forecast from the Forecasters' Club of New York. From 1990 to 1992 he was President of the New York Association for Business Economists. Mr. Moeller earned an M.B.A. in Finance from Fordham University, where he graduated in 1987. He holds a Bachelor of Arts in Economics from George Washington University.
More Economy in Brief


