 Global| Jan 21 2009
U.S. Chain Store Sales RecoverModestly
by:Tom Moeller
|in:Economy in Brief
Summary
Chain store sales last week rose 1.1%, but failed to recover even half of the prior week's 2.3% decline, according to the International Council of Shopping Centers-Goldman Sachs Index. As a result, for January so far sales have risen [...]
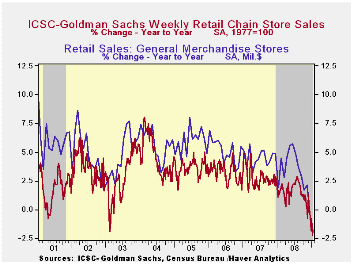
Chain store sales last week rose 1.1%, but failed to recover
even half of the prior week's 2.3% decline, according to the
International Council of Shopping Centers-Goldman Sachs Index. As a
result, for January so far sales have risen a modest 0.5% from December
when sales rose 0.3%. These gains follow three consecutive months of
decline between 1.0% and 1.9%. The year-to year change of -1.8% stands
as the weakest since early 2003.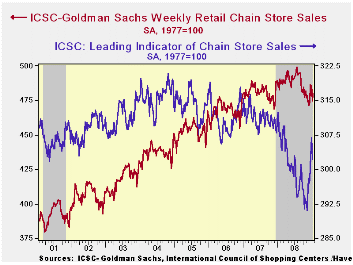
The ICSC-Goldman Sachs retail chain-store sales index is constructed using the same-store sales (stores open for one year) reported by 78 stores of seven retailers: Dayton Hudson, Federated, Kmart, May, J.C. Penney, Sears and Wal-Mart.
During the last ten years there has been a 64% correlation between the year-to-year growth in chain store sales and the growth in general merchandise sales.
The outlook for sales is for modest recovery as suggested by the weekly leading indicator of chain store sales from ICSC-Goldman Sachs. It fell 1.5% after a modest 0.6% rise in the opening week of January. Nevertheless, there were strong week-to-week increases during December. Therefore, the average level so far in January is up 1.5% from December, which rose 2.1% versus November. Since the lows of one month ago the index has recovered 3.8%.
The chain store sales figures are available in Haver's SURVEYW database.
After Rocky 2008, U.S. Consumers Seek Stable Ground in 2009 from the Federal Reserve Bank of Atlanta can be found here.
| ICSC-UBS (SA, 1977=100) | 01/17/09 | 01/10/09 | Y/Y | 2008 | 2007 | 2006 |
|---|---|---|---|---|---|---|
| Total Weekly Chain Store Sales | 479.8 | 474.5 | -1.8% | 1.4% | 2.8% | 3.3% |
Italy's Trade Picture Deteriorates
by Robert Brusca January 21, 2009
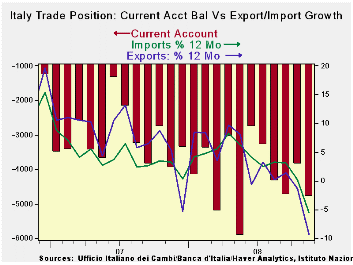
Deterioration in trade is becoming a global theme as exports
and imports both falter in its widespread global slowdown. For Italy
the trade and current account positions also have deteriorated. The
current account deficit is winder and the trade surplus has turned to
deficit in November.
Italy’s exports are dropping but the pace of the drop is not
accelerating. For imports the pace of decline is accelerating. Not
surprisingly transportation equipment is the weakest flow on both the
export and import side. All main trade categories are slowing declines
on both the export and import side.
Italy’s exports made their largest Yr/Yr drop since 1991.
Italy's trade balance with European Union countries shrank to a surplus
of EUR151 million from EUR291 million a year ago.
| Italy's Trade Trends | |||||||
|---|---|---|---|---|---|---|---|
| m/mo % monthly rate | Period Specified saar | ||||||
| Nov-08 | Oct-08 | Sep-08 | 3-MO | 6-Mo | 12-Mo | Yr-Ago | |
| Current Account Bal | €€ (4,787) | €€ (3,854) | €€ (4,742) | €€ (4,461) | €€ (3,962) | €€ (4,070) | €€ (2,938) |
| Goods Balance | €€ (676) | €€ 716 | €€ (17) | €€ 8 | €€ (469) | €€ (38) | €€ 358 |
| Exports | -10.6% | 1.3% | 9.6% | -2.8% | -18.2% | -6.9% | 6.6% |
| Imports | -6.4% | -1.0% | 3.5% | -15.3% | -10.8% | -3.1% | 3.9% |
| Services Balance | €€ (849) | €€ (1,747) | €€ (919) | €€ (1,172) | €€ (790) | €€ (587) | €€ (616) |
| Exports | -12.3% | 3.8% | 9.7% | -0.5% | 3.9% | 0.5% | 3.8% |
| Imports | -19.4% | 13.1% | 12.5% | 10.7% | 2.0% | 5.5% | 6.7% |
| Not Seasonally Adjusted | All Yr/Yr | ||||||
| Exports | Nov-08 | Nov-07 | Nov-06 | Nov-05 | |||
| Food&Bev | -2.2% | 8.4% | 5.0% | 8.9% | |||
| Capital Gds | -13.5% | 11.7% | 16.0% | -0.5% | |||
| Transport | -25.7% | 19.4% | 20.3% | -16.4% | |||
| Consumer Gds | -10.1% | -1.0% | 7.9% | 12.0% | |||
| Other Gds | -13.3% | -9.6% | 11.8% | 34.0% | |||
| Imports | Nov-08 | Nov-07 | Nov-06 | Nov-05 | |||
| Food&Bev | -6.5% | 3.4% | 5.1% | 8.7% | |||
| Capital Gds | -19.2% | 6.5% | 3.0% | 6.5% | |||
| Transport | -30.3% | 12.9% | 3.4% | 3.7% | |||
| Consumer Gds | -7.2% | -0.4% | 6.7% | 11.8% | |||
| Other Gds | 2.3% | -4.6% | 22.0% | 19.4% | |||
| Balances in Mlns of euros | |||||||
German PPI Points To Lower Inflation Ahead
by Robert Brusca January 21, 2009
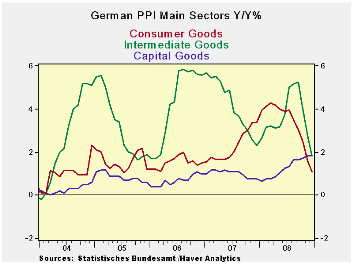
Germany’s PPI for manufactured goods fell by 0.8% in December
and is falling at an accelerated rate along with its ex-energy measure.
In the fourth quarter MFG producer prices fell at a 4% pace compared to
ex–energy prices that fell at a 3.2% pace. Price weakness is
broad-based. The chart above highlights the ongoing weakness in
consumer and intermediate goods prices. Capital goods prices are not
yet showing much in the way of decline. But in orders data, capital
goods orders are declining and orders are falling on a broad front.
Prices may be more resilient for capital goods but that is not a sign
of economic health. It may be a sign of the longer lags in producing
capital goods. As such the price weakness may not show up for several
months more.
| Germany PPI | ||||||||
|---|---|---|---|---|---|---|---|---|
| %m/m | %-SAAR | |||||||
| Dec-08 | Nov-08 | Oct-08 | 3-mo | 6-mo | 12-mo | 12-moY-Ago | IN Q4 | |
| MFG | -0.8% | -1.0% | -0.2% | -7.8% | 0.0% | 4.4% | 2.4% | -4.0% |
| Ex Energy | -0.4% | -0.6% | -0.3% | -5.4% | -0.7% | 1.5% | 2.2% | -3.2% |

Tom Moeller
AuthorMore in Author Profile »Prior to joining Haver Analytics in 2000, Mr. Moeller worked as the Economist at Chancellor Capital Management from 1985 to 1999. There, he developed comprehensive economic forecasts and interpreted economic data for equity and fixed income portfolio managers. Also at Chancellor, Mr. Moeller worked as an equity analyst and was responsible for researching and rating companies in the economically sensitive automobile and housing industries for investment in Chancellor’s equity portfolio. Prior to joining Chancellor, Mr. Moeller was an Economist at Citibank from 1979 to 1984. He also analyzed pricing behavior in the metals industry for the Council on Wage and Price Stability in Washington, D.C. In 1999, Mr. Moeller received the award for most accurate forecast from the Forecasters' Club of New York. From 1990 to 1992 he was President of the New York Association for Business Economists. Mr. Moeller earned an M.B.A. in Finance from Fordham University, where he graduated in 1987. He holds a Bachelor of Arts in Economics from George Washington University.
More Economy in Brief


