 Global| Oct 15 2007
U.S. Business Inventories'Increase Down With Slower Sales Growth
by:Tom Moeller
|in:Economy in Brief
Summary
Weakening growth in U.S. sales has necessitated a dramatic slowing of growth in business inventories during the last year. Annual growth in business sales has more than halved to 3% as of August. That decline has been led by weaker [...]
Weakening growth in U.S. sales has necessitated a dramatic slowing of growth in business inventories during the last year.
Annual growth in business sales has more than halved to 3% as of August. That decline has been led by weaker growth in manufacturers' sales to 2.4% from 8.5% one year ago and slower growth in merchant wholesale sales to 6.8% y/y from 12.3%.
Retailer's sales have held up relatively well at 5.0% over the last year versus 6.2% during all of 2006, though that year's strength was concentrated early in the year and then fell off.
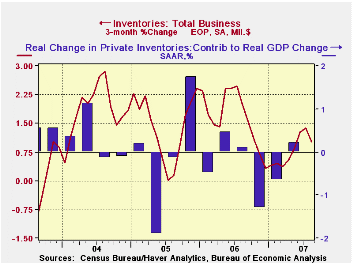
Total business inventories rose 0.1% in August. Y/Y growth, a measure of the trend, dropped down to 3.0%, half that for all of 2006.
Retail inventories grew 0.5% (2.6% y/y) in August. The inventories of motor vehicles & parts dealers were relatively firm at 1.5% (1.3% y/y) in August but that is down from 12.8% y/y growth twelve months ago. Excluding autos, retail inventories were unchanged in August and twelve month growth of 3.3% was about even with 2006, but both were down from 7.9% at the beginning of 2005. Furniture inventories fell slightly in August and twelve month growth of 1.5% has dropped from 4.2% last August and 11.1% at the beginning of 2005. At clothing & accessory stores, August inventories were about unchanged m/m and twelve month growth of 5.8% compares to 13.2% at the beginning of the year.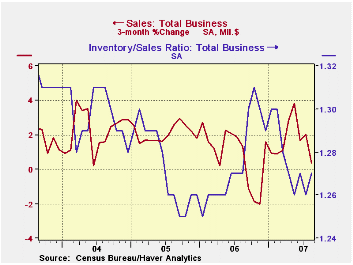
Wholesale inventories increased 0.1% and y/y growth of 4.4% is half that of last year. Petroleum inventories were about unchanged versus last year versus 60% growth at the beginning of 2006. Still, less petroleum wholesale inventories are up 4.5% which is about half the twelve month growth for all of last year.
Factory inventories actually fell slightly in August as part of a weakening trend since last year which has brought twelve month growth down to 2.4% from 8.5% at the middle of last year.
| Business Inventories | August | July | Y/Y | 2006 | 2005 | 2004 |
|---|---|---|---|---|---|---|
| Total | 0.1% | 0.5% | 3.0% | 5.9% | 6.2% | 7.9% |
| Retail | 0.5% | 1.0% | 2.6% | 3.2% | 2.8% | 6.8% |
| Retail excl. Autos | 0.0% | 0.1% | 3.3% | 4.5% | 4.5% | 7.2% |
| Wholesale | 0.1% | 0.2% | 4.4% | 8.6% | 7.4% | 9.7% |
| Manufacturing | -0.1% | 0.1% | 2.4% | 6.4% | 8.9% | 7.7% |

Tom Moeller
AuthorMore in Author Profile »Prior to joining Haver Analytics in 2000, Mr. Moeller worked as the Economist at Chancellor Capital Management from 1985 to 1999. There, he developed comprehensive economic forecasts and interpreted economic data for equity and fixed income portfolio managers. Also at Chancellor, Mr. Moeller worked as an equity analyst and was responsible for researching and rating companies in the economically sensitive automobile and housing industries for investment in Chancellor’s equity portfolio. Prior to joining Chancellor, Mr. Moeller was an Economist at Citibank from 1979 to 1984. He also analyzed pricing behavior in the metals industry for the Council on Wage and Price Stability in Washington, D.C. In 1999, Mr. Moeller received the award for most accurate forecast from the Forecasters' Club of New York. From 1990 to 1992 he was President of the New York Association for Business Economists. Mr. Moeller earned an M.B.A. in Finance from Fordham University, where he graduated in 1987. He holds a Bachelor of Arts in Economics from George Washington University.
More Economy in Brief


