 Global| Jan 14 2009
U.S. Business Inventories Fell Further
by:Tom Moeller
|in:Economy in Brief
Summary
Total business inventories fell 0.7% during November and it was the third consecutive monthly decline. Inventories just aren't needed as sales drop. The 6.6% annual rate of decline in inventories during the last three months is the [...]
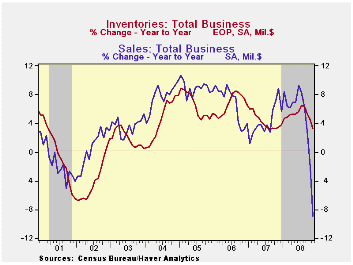 Total business inventories fell 0.7% during November and it was the
third consecutive monthly decline. Inventories just aren't needed as
sales drop. The 6.6% annual rate of decline in inventories during the
last three months is the swiftest since early 2002. The sales decline
during that period, including the 5.1% November shortfall, was 37.4% at
an annual rate. That mismatch left the inventory/sales ratio surging
upward to 1.41. The November level was the highest since during the
recession of 2001 and the increase in the ratio during the last year is
the swiftest since 1982. The reversal ended a twenty eight year
downtrend.
Total business inventories fell 0.7% during November and it was the
third consecutive monthly decline. Inventories just aren't needed as
sales drop. The 6.6% annual rate of decline in inventories during the
last three months is the swiftest since early 2002. The sales decline
during that period, including the 5.1% November shortfall, was 37.4% at
an annual rate. That mismatch left the inventory/sales ratio surging
upward to 1.41. The November level was the highest since during the
recession of 2001 and the increase in the ratio during the last year is
the swiftest since 1982. The reversal ended a twenty eight year
downtrend.
Tighter inventory management enabled retailers to buck the
uptrend so inventories fell 1.3% during November. 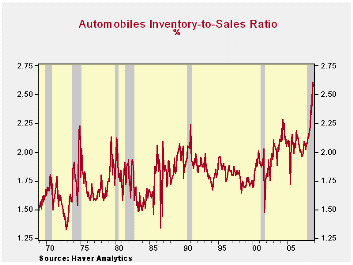 That left the
three-month change at a negative 5.2%. Motor vehicle
inventories have led the decumulation. Down 1.7% during November, they
have fallen at a 9.7% annual rate during the last three months. But
they've got further to fall. The inventory-to-sales ratio for
automobiles has jumped to 2.57 which is by far a historic high. So
unless sales recover soon, expect further production cuts to reduce the
ratio.
That left the
three-month change at a negative 5.2%. Motor vehicle
inventories have led the decumulation. Down 1.7% during November, they
have fallen at a 9.7% annual rate during the last three months. But
they've got further to fall. The inventory-to-sales ratio for
automobiles has jumped to 2.57 which is by far a historic high. So
unless sales recover soon, expect further production cuts to reduce the
ratio.
Outside of autos, retailers have been busy cutting inventory as
well. Furniture, home furnishings & electronics inventories
fell all of 5.7% in November. 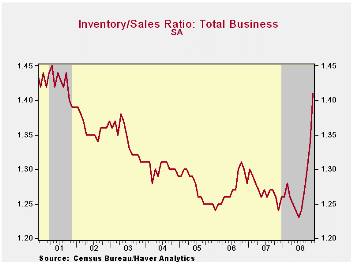 Apparel retailers were busy as
well, but less aggressive. Inventories here fell just 0.3% and they've
been flat for nearly two years. Unfortunately, given the weak
performance of sales the I/S ratio has risen sharply, to its highest
level since 2003. General merchandise inventories fell 0.6%
(-0.6% y/y) and that was been very much enough to keep the inventory
position in good shape.
Apparel retailers were busy as
well, but less aggressive. Inventories here fell just 0.3% and they've
been flat for nearly two years. Unfortunately, given the weak
performance of sales the I/S ratio has risen sharply, to its highest
level since 2003. General merchandise inventories fell 0.6%
(-0.6% y/y) and that was been very much enough to keep the inventory
position in good shape.
| Business Inventories | November | October | September | Y/Y | 2007 | 2006 | 2005 |
|---|---|---|---|---|---|---|---|
| Total | -0.7% | -0.6% | -0.4% | 3.3% | 3.8% | 5.9% | 6.0% |
| Retail | -1.3% | -0.2% | 0.2% | -1.2% | 2.6% | 3.5% | 2.3% |
| Retail excl. Auto | -1.0% | -0.1% | 0.4% | 0.6% | 2.7% | 4.9% | 3.9% |
| Wholesale | -0.6% | -1.2% | -0.4% | 6.3% | 5.5% | 8.3% | 7.3% |
| Manufacturing | -0.3% | -0.6% | -0.8% | 5.1% | 3.7% | 6.4% | 8.9% |

Tom Moeller
AuthorMore in Author Profile »Prior to joining Haver Analytics in 2000, Mr. Moeller worked as the Economist at Chancellor Capital Management from 1985 to 1999. There, he developed comprehensive economic forecasts and interpreted economic data for equity and fixed income portfolio managers. Also at Chancellor, Mr. Moeller worked as an equity analyst and was responsible for researching and rating companies in the economically sensitive automobile and housing industries for investment in Chancellor’s equity portfolio. Prior to joining Chancellor, Mr. Moeller was an Economist at Citibank from 1979 to 1984. He also analyzed pricing behavior in the metals industry for the Council on Wage and Price Stability in Washington, D.C. In 1999, Mr. Moeller received the award for most accurate forecast from the Forecasters' Club of New York. From 1990 to 1992 he was President of the New York Association for Business Economists. Mr. Moeller earned an M.B.A. in Finance from Fordham University, where he graduated in 1987. He holds a Bachelor of Arts in Economics from George Washington University.
More Economy in Brief


