 Global| Oct 15 2007
U.S. Budget Deficit Narrowed Sharply
by:Tom Moeller
|in:Economy in Brief
Summary
For Fiscal Year 2007, the U.S. government's budget deficit narrowed sharply to 162.8B versus a deficit during FY 2006 of 248.2B. For the third consecutive year, the deficit's narrowing occurred as revenue growth surged ahead of [...]
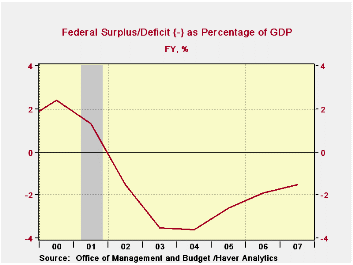
For Fiscal Year 2007, the U.S. government's budget deficit narrowed sharply to 162.8B versus a deficit during FY 2006 of 248.2B. For the third consecutive year, the deficit's narrowing occurred as revenue growth surged ahead of outlays.
As a percentage of GDP the budget deficit last year totaled roughly 1.5%, down sharply from 3.6% in 2004. Receipts rose sharply to 18.8% of GDP, about equal to the long term average.
For forecasts of the deficit in coming fiscal years, the administration's latest Midsession Review of the Budget can be found here.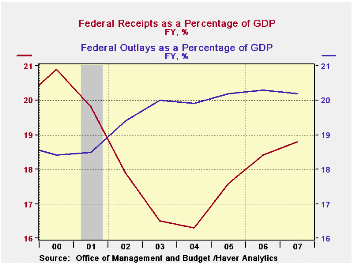
The Government's financial data is available in Haver's USECON database.
Net revenues last fiscal year grew 6.7% y/y, quite a slowdown from 11.8% growth during FY06. Growth in individual income tax receipts (44% of total receipts), however, held firm at 11.5%. Withheld taxes grew 9.4% during FY07 but non-withheld taxes rose a much stronger 13.0% due to estimated capital gains. Corporate income taxes (13% of total receipts) lagged and rose just 4.6% while a slowdown in employment growth raised employment contributions by just 4.3% versus a 5.7% gain during FY06 and 8.5% during FY05.
U.S. net outlays grew just 2.8% during last fiscal year, a slowdown from 7.4% during FY06. Defense spending (19% of total outlays) picked up a bit and rose 6.1%. Medicare expenditures (12% of outlays) again surged by 13.8% after a 10.5% jump during FY06. Social security spending (21% of outlays) picked up slightly to 6.9% but growth in the government's interest expense declined to rose by 5.0% y/y.
| US Government Finance | September | July | Y/Y | FY 2007 | FY 2006 | FY 2005 |
|---|---|---|---|---|---|---|
| Budget Balance | $111.6B | $-117.0B | $56.2B (9/06) |
-$162.8B | -$248.2B | -$318.7B |
| Net Revenues | $285.4B | $166.5B | 0.7% | 6.7% | 11.8% | 14.1% |
| Net Outlays | $173.8B | $283.5B | -23.5% | 2.8% | 7.4% | 7.6% |
by Tom Moeller October 15, 2007
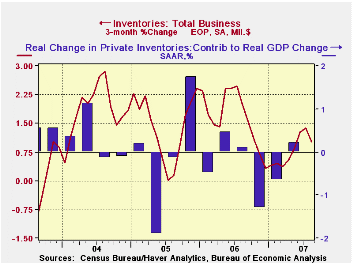
Weakening growth in U.S. sales has necessitated a dramatic slowing of growth in business inventories during the last year.
Annual growth in business sales has more than halved to 3% as of August. That decline has been led by weaker growth in manufacturers' sales to 2.4% from 8.5% one year ago and slower growth in merchant wholesale sales to 6.8% y/y from 12.3%.
Retailer's sales have held up relatively well at 5.0% over the last year versus 6.2% during all of 2006, though that year's strength was concentrated early in the year and then fell off.
Total business inventories rose 0.1% in August. Y/Y growth, a measure of the trend, dropped down to 3.0%, half that for all of 2006.
Retail inventories grew 0.5% (2.6% y/y) in August. The inventories of motor vehicles & parts dealers were relatively firm at 1.5% (1.3% y/y) in August but that is down from 12.8% y/y growth twelve months ago. Excluding autos, retail inventories were unchanged in August and twelve month growth of 3.3% was about even with 2006, but both were down from 7.9% at the beginning of 2005. Furniture inventories fell slightly in August and twelve month growth of 1.5% has dropped from 4.2% last August and 11.1% at the beginning of 2005. At clothing & accessory stores, August inventories were about unchanged m/m and twelve month growth of 5.8% compares to 13.2% at the beginning of the year.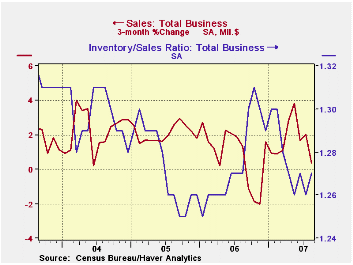
Wholesale inventories increased 0.1% and y/y growth of 4.4% is half that of last year. Petroleum inventories were about unchanged versus last year versus 60% growth at the beginning of 2006. Still, less petroleum wholesale inventories are up 4.5% which is about half the twelve month growth for all of last year.
Factory inventories actually fell slightly in August as part of a weakening trend since last year which has brought twelve month growth down to 2.4% from 8.5% at the middle of last year.
| Business Inventories | August | July | Y/Y | 2006 | 2005 | 2004 |
|---|---|---|---|---|---|---|
| Total | 0.1% | 0.5% | 3.0% | 5.9% | 6.2% | 7.9% |
| Retail | 0.5% | 1.0% | 2.6% | 3.2% | 2.8% | 6.8% |
| Retail excl. Autos | 0.0% | 0.1% | 3.3% | 4.5% | 4.5% | 7.2% |
| Wholesale | 0.1% | 0.2% | 4.4% | 8.6% | 7.4% | 9.7% |
| Manufacturing | -0.1% | 0.1% | 2.4% | 6.4% | 8.9% | 7.7% |
by Louise Curley October 15, 2007
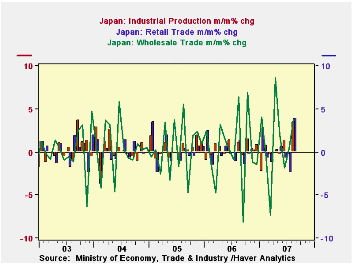
The ups and downs in the Japanese economy continue. Today's data for August are coming in on the up side. The monthly increase in industrial production was 3.52% in August after a decline of 0.4% in July. Comparable figures for retail sales were 3.9% and -2.5% and for wholesale trade, 3.8% and 3.8%. The month to month changes in industrial production, retail and wholesale trade shown in the first chart illustrate the up and down path these series followed over the past five years.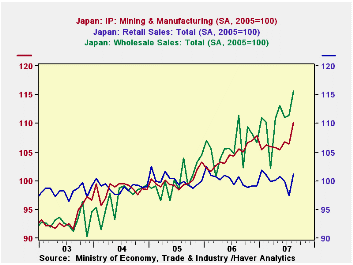
The monthly increases in industrial production and wholesale trade have been greater than the declines, with the result that these series show positive trends. The monthly increases in retail sales, on the other hand, have barely offset the decreases with the result that the retail trade data are more or less trend less. The second chart, shows the indexes of industrial production, retail and wholesale trade. (We have changed the base of the industrial production index from 2000 to 2005 to be comparable with the other series.)
The continued weakness in the consumer sector may have been a factor in the decision of the Bank of Japan to hold its benchmark interest rates at 0.5% this Monday. But probably, and more importantly, is the uncertainty caused by the continued negative adjustments taking place in the U. S. housing market as a result of its sub prime mortgage problem.
| JAPAN | Aug 07 | Jul 07 | Aug 06 | M/M Chg | Y/Y Chg | 2006 | 2005 | 2004 |
|---|---|---|---|---|---|---|---|---|
| Industrial Production (2000=100) | 111.9 | 108.1 | 107.2 | 3.5 | 4.4 | 106.1 | 101.6 | 100.0 |
| Industrial Production (2005=100) | 110.2 | 106.4 | 105.5 | 3.5 | 4.4 | 104.5 | 100.0 | 98.5 |
| Retail Sales (2005=100) | 101.2 | 97.4 | 100.7 | 3.9 | 0.5 | 100.2 | 100.1 | 98.9 |
| Wholesale Sales (2005=100) | 115.6 | 111.4 | 111.4 | 3.8 | 3.8 | 105.9 | 100.1 | 96.9 |
by Robert Brusca October 15, 2007
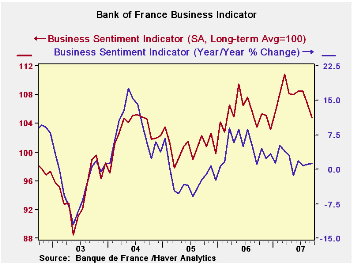
The Bank of France overall index is in the bottom 40 percent of its range with its drop off in September and is barely higher Yr/Yr. Production is in the bottom 20% of its range but the production OUTLOOK is in the top 20 percent of its range. Demand in terms of the order books is firm at just about the top 30 percent of its range but foreign order books are in the bottom 20 percent of their range. New orders are in the bottom 20 percent of their range, with agriculture, an important sector in France, in the bottom 10 percent of its range.
Hiring is only in the 28th percentile of its range but the outlook is - very surprisingly - a strong reading in the 98th percentile of its range. That is the strongest outlook reading in the survey and that is surprising especially with other outlook readings not nearly as strong.
| Bank of France Monthly INDUSTRY Survey | ||||||
|---|---|---|---|---|---|---|
| 12 MO | Since Jan-87 | Percentile | ||||
| Sep-07 | Aug-07 | Jul-07 | AVERAGE | Average | rank/range | |
| Production-latest mo | ||||||
| Total Industry | 0.95 | 9.34 | 12.73 | 9 | 9 | 19.9% |
| Semi-Finished | -7.53 | 3.32 | 14.17 | 7 | 7 | 6.0% |
| Capital | 5.91 | 10.88 | 12.84 | 13 | 10 | 19.3% |
| Auto | 22.37 | 27.31 | 2.24 | 4 | 8 | 75.9% |
| Consumer | 5.7 | 15.07 | 19.43 | 10 | 12 | 28.5% |
| Agriculture & Food | 2.12 | 4.11 | 8.1 | 10 | 10 | 16.7% |
| Production Outlook | ||||||
| Total Industry | 12.68 | 7.9 | 2.21 | 9 | 10 | 82.0% |
| Semi-Finished | 19.93 | -2.45 | -5.6 | 9 | 9 | 98.0% |
| Capital | 19.32 | 12.6 | 7.2 | 15 | 12 | 81.9% |
| Auto | 25.47 | -11.9 | -39.5 | -5 | 4 | 90.3% |
| Consumer | 6.19 | 5.32 | -0.29 | 9 | 14 | 21.9% |
| Agriculture & Food | 16.21 | 11.82 | 9.9 | 15 | 14 | 81.6% |
| Demand | ||||||
| Overall order books | 24.76 | 26.14 | 28.52 | 26 | 4 | 69.6% |
| Foreign Orders | 5.04 | 12.01 | 12.98 | 12 | 9 | 19.2% |
| New Orders | ||||||
| Total Industry | 1.9 | 12.46 | 17.01 | 12 | 10 | 17.1% |
| Semi-Finished | -4.76 | 7.21 | 16.18 | 9 | 8 | 15.1% |
| Capital | 8.29 | 8.63 | 12.97 | 14 | 9 | 15.5% |
| Auto | ||||||
| Consumer | 4.72 | 12.92 | 19.12 | 12 | 13 | 18.5% |
| Agriculture & Food | 2.84 | 13.92 | 15 | 14 | 12 | 9.9% |
| Stocks: Finished Gds | ||||||
| Total Industry | 0.43 | 0 | -0.43 | -2 | -2 | 90.0% |
| Semi-Finished | 1.46 | -1.91 | -2.29 | -3 | -2 | 82.9% |
| Capital | 0.82 | -3.81 | -4.44 | 0 | -3 | 64.2% |
| Auto | -16.03 | -10.12 | -4.21 | -5 | -3 | 24.4% |
| Consumer | 0.11 | 4.44 | 2.76 | -1 | 0 | 49.5% |
| Agriculture & Food | -0.19 | 5.07 | 4.32 | 1 | 0 | 50.5% |
| Capacity Utilization | 85.19 | 83.07 | 85.25 | 85 | 85 | 72.0% |
| Hiring | ||||||
| Latest Month | -1.59 | -0.29 | 0.01 | 0 | -1 | 28.6% |
| Outlook | 0.35 | -2.22 | -4.79 | -4 | -5 | 98.0% |
| Industry Sentiment Index | 104.78 | 106.63 | 108.49 | 107 | 106 | 38.7% |
by Robert Brusca October 15, 2007
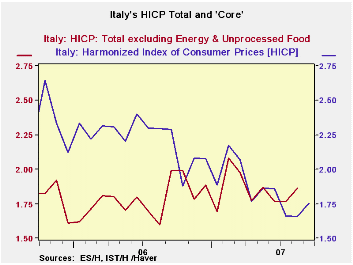
Italy’s inflation has fallen for the overall measure. But the chart also shows that the CORE inflation has been on a gradually elevating trend. Both the core and headline rate accelerated slightly in terms of their Yr/Yr rates in September. Still, the core and the overall rates are nicely below the ECB’s overall 2% inflation ceiling.
In September, Italy’s inflation report was turbulent. It was bifurcated, with six categories showing inflation on the month (m/m %) of 0.3% or greater. But there were also five main categories with the monthly price level actually falling by 0.2% or more. Food, alcohol and education prices were up the most in the month. The weakest prices were at restaurants and hotels, for recreation and culture and for communications. With this sort of turbulence in the market, it is a difficult time to get a read on true inflation trends in Italy. Diffusion readings show that over 3 months and 6 months inflation is accelerating in more categories that it is decelerating. Year-over-year, Italy’s trends are neutral.
| Italy HICP and CPI details | |||||||
|---|---|---|---|---|---|---|---|
| Mo/Mo % | Saar % | Yr/Yr | |||||
| Sep-07 | Aug-07 | Jul-07 | 3-Mo | 6-Mo | 12-Mo | Yr Ago | |
| HICP Total | 0.3% | 0.2% | -0.1% | 1.5% | 1.7% | 1.8% | 2.3% |
| Core | #N/A | 0.2% | 0.0% | #N/A | #N/A | #N/A | 2.0% |
| CPI | |||||||
| All | 0.2% | 0.1% | 0.2% | 1.8% | 2.3% | 1.7% | 2.1% |
| CPI excl Tobacco | 0.2% | 0.1% | 0.3% | 2.1% | 2.3% | 1.6% | 2.1% |
| Food | 0.7% | 0.4% | 0.4% | 6.1% | 4.3% | 2.9% | 2.4% |
| Alcohol | 0.6% | 0.6% | -0.7% | 2.2% | 2.5% | 2.4% | 5.1% |
| Clothing & Shoes | 0.3% | 0.2% | 0.2% | 2.4% | 1.7% | 1.5% | 1.3% |
| Rent & Utilities | 0.3% | 0.2% | 0.0% | 1.9% | 1.1% | 1.4% | 5.7% |
| Housing & Furniture | 0.2% | 0.2% | 0.2% | 2.2% | 3.5% | 2.8% | 1.5% |
| Health Care | -0.2% | 0.2% | 0.1% | 0.3% | -0.8% | -0.2% | 0.0% |
| Transport | -0.2% | -0.7% | 0.6% | -1.4% | 2.4% | 2.0% | 2.0% |
| Communication | -0.3% | 0.0% | 0.0% | -1.1% | -1.4% | -8.8% | -3.4% |
| Recreation & Culture | -0.4% | 0.3% | 0.1% | 0.0% | -0.5% | 0.2% | 1.1% |
| Education | 0.9% | 0.1% | 0.2% | 5.4% | 4.0% | 3.1% | 2.1% |
| Restaurant & Hotel | -0.5% | 0.3% | 0.3% | 0.5% | 2.4% | 2.4% | 2.4% |
| Other | 0.3% | 0.3% | 0.2% | 3.2% | 3.3% | 2.5% | 2.7% |
| Diffusion | 58.3% | 66.7% | 50.0% | ||||
| Type: | Diffusion: Compared to | 6-mo | 12-mo | Yr-Ago | -- | ||

Tom Moeller
AuthorMore in Author Profile »Prior to joining Haver Analytics in 2000, Mr. Moeller worked as the Economist at Chancellor Capital Management from 1985 to 1999. There, he developed comprehensive economic forecasts and interpreted economic data for equity and fixed income portfolio managers. Also at Chancellor, Mr. Moeller worked as an equity analyst and was responsible for researching and rating companies in the economically sensitive automobile and housing industries for investment in Chancellor’s equity portfolio. Prior to joining Chancellor, Mr. Moeller was an Economist at Citibank from 1979 to 1984. He also analyzed pricing behavior in the metals industry for the Council on Wage and Price Stability in Washington, D.C. In 1999, Mr. Moeller received the award for most accurate forecast from the Forecasters' Club of New York. From 1990 to 1992 he was President of the New York Association for Business Economists. Mr. Moeller earned an M.B.A. in Finance from Fordham University, where he graduated in 1987. He holds a Bachelor of Arts in Economics from George Washington University.
More Economy in Brief


