 Global| Jan 20 2009
U.S. Budget Deficit Above $1Trillion This Year
by:Tom Moeller
|in:Economy in Brief
Summary
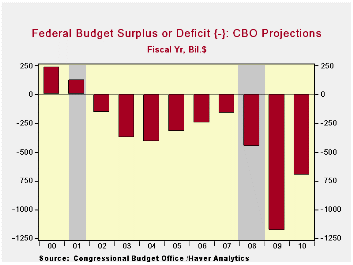
The U.S. Congressional Budget Office currently projects that the government's budget deficit will total $1.2 trillion dollars this fiscal year before falling to $703 billion in FY 2010. However, many forecasts from the private sector [...]

The U.S. Congressional Budget Office currently projects that the government's budget deficit will total $1.2 trillion dollars this fiscal year before falling to $703 billion in FY 2010. However, many forecasts from the private sector expect no such improvement.
Behind the CBO projection is a 1.5% advance in 2010 real GDP. That depends mostly on the current recession ending in 2Q of this year, with growth rebounding, albeit moderately, thereafter. If GDP growth fails to turn positive that quickly, then the 7.5% expected advance in government revenues clearly would be in jeopardy.
At 8.3% of GDP this fiscal year, the budget deficit would well exceed the deficits of the 1980s. They were close to 5% of GDP and ran at that level for nearly ten years due to tax cuts and the defense buildup. Deficits only slightly smaller continued well into the 1990s but by the end of the decade, surpluses emerged. By then revenue growth averaged 8% to 10% year-to-year and growth in outlays was quite subdued.
The Budget and Economic Outlook: Fiscal Years 2009 to 2019 from the Congressional Budget Office is available here
The Congressional Budget Office forecasts are available Haver's USECON database.
The Recession in Perspective from the
Federal Reserve Bank of Minneapolis is available
here.
Germany's Zew Indicators: Expectations Less Pessimistic Current Conditions Continue To Worsen
by Louise Curley January 20, 2009

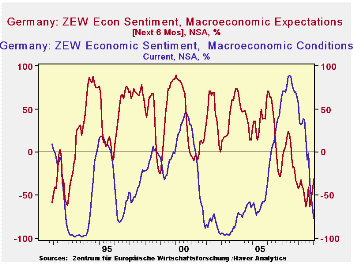
Germany's ZEW indicator of expectations of economic
conditions* six months ahead improved for the third month in a row in
January. It is, however, still negative at -31%, and well below its
long term average of a positive 26.5%. The indicator of current
economic conditions** continued to decline and was -77.1%, 12.6
percentage points below December's 64.5%. The first chart shows both
indicators since December 1991, when the series began, to date. The
current conditions indicator has, at times, been even lower than
January reading, but the expectations indicator has rarely been as low
as the recent readings.
The survey which was conducted between January 5 and January 19 polled 312 analysts and institutional investors. During this period, in response to increasingly discouraging statistics, the European central Bank reduced its benchmark rate for the fourth time since September when it was 4.25% to 2% on January 15. In addition, the German government agreed to a second stimulus package, amounting to 80 billion euros over the next two years. These fiscal and monetary measures, have helped, no doubt, to lower the difference between the pessimists and the optimists regarding the outlook.
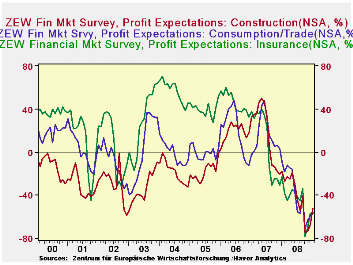
They may also account for the improvement in the profit expectations of three of the industries that are covered in the survey. (See the second chart). The percent balance in the Construction industry rose to -52.0% in January from -67.8% in December and in the Consumption/Trade Industry to -56.7% in January from -59.3% in December. The improvement in the profit outlook of the Insurance industry, to -56.5% in January from -56.6% in December is so small that it might properly be indicative of stability rather than improvement.
| GERMANY ZEW INDICATORS (% Balance) | Jan 09 | Dec 08 | Nov 08 | Oct 08 | Sep 08 | Aug 08 | July 08 |
|---|---|---|---|---|---|---|---|
| Current Conditions | -77.1 | -64.5 | -50.4 | -35.9 | -1.0 | -9.2 | 17.0 |
| Expectation, 6 mo ahead | -31.0 | -45.2 | -53.5 | 63.0 | -41.1 | -55.5 | -63.9 |
| Profit Expectations, 6 mo ahead | |||||||
| Construction | -52.0 | -67.8 | -73.8 | -74.4 | -42.0 | -53.9 | -45.0 |
| Consumption/Trade | -56.7 | -59.3 | -64.0 | -71.0 | -40.8 | -57.0 | -55.4 |
| Insurance | -56.5 | -56.6 | -70.1 | -77.9 | -34.3 | -45.1 | -42.1 |
| ECB Interest Rate %) | 2.0 | 2.50 | 3.25 | 3.25 | 4.25 | 4.25 | 4.25 |
Tom Moeller
AuthorMore in Author Profile »Prior to joining Haver Analytics in 2000, Mr. Moeller worked as the Economist at Chancellor Capital Management from 1985 to 1999. There, he developed comprehensive economic forecasts and interpreted economic data for equity and fixed income portfolio managers. Also at Chancellor, Mr. Moeller worked as an equity analyst and was responsible for researching and rating companies in the economically sensitive automobile and housing industries for investment in Chancellor’s equity portfolio. Prior to joining Chancellor, Mr. Moeller was an Economist at Citibank from 1979 to 1984. He also analyzed pricing behavior in the metals industry for the Council on Wage and Price Stability in Washington, D.C. In 1999, Mr. Moeller received the award for most accurate forecast from the Forecasters' Club of New York. From 1990 to 1992 he was President of the New York Association for Business Economists. Mr. Moeller earned an M.B.A. in Finance from Fordham University, where he graduated in 1987. He holds a Bachelor of Arts in Economics from George Washington University.
More Economy in Brief
 Global| Feb 05 2026
Charts of the Week: Balanced Policy, Resilient Data and AI Narratives
by:Andrew Cates


