 Global| Oct 11 2007
U.S. August Trade Deficit Smallest Since January
by:Tom Moeller
|in:Economy in Brief
Summary
The U.S. foreign trade deficit in August narrowed very slightly to $57.6B from $59.0B in July which was revised slightly shallower from the initial report. The August deficit was below Consensus expectations for a deficit of $58.7B. [...]
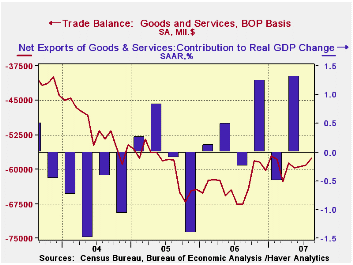
The U.S. foreign trade deficit in August narrowed very slightly to $57.6B from $59.0B in July which was revised slightly shallower from the initial report. The August deficit was below Consensus expectations for a deficit of $58.7B.
The August deficit was the lowest since January and the average deficit of $59.0B during the last eight months compares to an average of $64.7B during the first eight months of 2006.
U.S. exports rose just 0.4%, the smallest monthly increase since April.
Exports of goods rose 0.4% (13.3% y/y) though exports of capital goods fell 0.6% ( +9.9% y/y). Exports of advanced technology goods exports rose 4.8% (8.9% y/y) and recouped most of the prior month's 8.6% drop. Exports of autos & products fell 8.4% (+10.3% y/y) after a 14.5% surge during July. Exports of nonauto consumer goods worked the other way and rose 1.5% (12.9% y/y) while exports of foods, feeds & beverages surged 8.7% (26.2% y/y).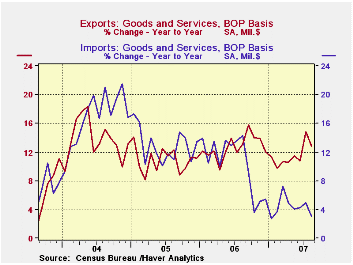
U.S. exports of services rose 0.6% (11.8% y/y) after a slight slip during July. The modest increase came as exports of travel surged 2.0% (14.8% y/y) and passenger fares also surged by 2.0% (11.7% y/y).
Overall imports fell 0.4% though imports of petroleum products rose 4.4% (-3.0% y/y) as the price per barrel of crude petroleum rose 3.9% (3.0% y/y). Imports of nonauto consumer goods fell 0.5% (+5.1% y/y) though capital goods imports rose 0.9% (+3.4% y/y). Imports of advanced technology products made up all of the prior month's decline and rose 3.1% (12.1% y/y).
The U.S. trade deficit in goods with China improved slightly m/m to $22.5B versus a deficit of $22.0B the during August of '06.
International Trade: Why We Don’t Have More of It from the Federal Reserve Bank of Philadelphia is available here.
Is the United States Losing Its Productivity Advantage? from the Federal Reserve Bank of New York can be found here.
| Foreign Trade | August | July | Y/Y | 2006 | 2005 | 2004 |
|---|---|---|---|---|---|---|
| U.S. Trade Deficit | $57.6B | $59.0B | $67.6B (8/06) |
$758.5 | $714.4B | $612.1B |
| Exports - Goods & Services | 0.4% | 2.7% | 12.8% | 12.7% | 10.9% | 13.7% |
| Imports - Goods & Services | -0.4% | 1.7% | 3.0% | 10.4% | 12.9% | 16.8% |
by Tom Moeller October 11, 2007
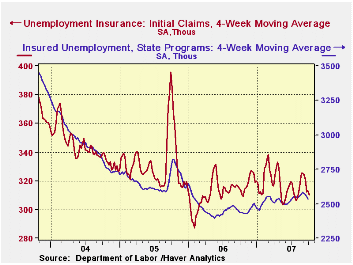
Initial claims for unemployment insurance opened the month of October with a reversal of most of prior week's rise and fell 12,000 to 308,000. The labor Department indicated that there were no special factors that distorted these readings.
The drop exceeded expectations for a decline to 316,000 claims and the four-week moving average of initial claims fell to 310,250 (-1.3% y/y).
A claims level below 400,000 typically has been associated with growth in nonfarm payrolls. During the last six years there has been a (negative) 78% correlation between the level of initial claims and the m/m change in nonfarm payroll employment.
Continuing claims for unemployment insurance fell for the third week in the last four by a large 15,000 to 2,521. The drop added to the decline during the prior week which was revised from a slight increase. The latest declines suggest that the pace of rehiring may have picked up.
The continuing claims numbers lag the initial claims figures by one week.
The insured rate of unemployment was stable at 1.9%, off the peaks in August of 2.0% held for two consecutive weeks at month- end.
| Unemployment Insurance (000s) | 10/06/07 | 09/29/07 | Y/Y | 2006 | 2005 | 2004 |
|---|---|---|---|---|---|---|
| Initial Claims | 308 | 320 | -0.3% | 313 | 331 | 343 |
| Continuing Claims | -- | 2,521 | 3.7% | 2,545 | 3.3% | 2,459 |
by Tom Moeller October 11, 2007
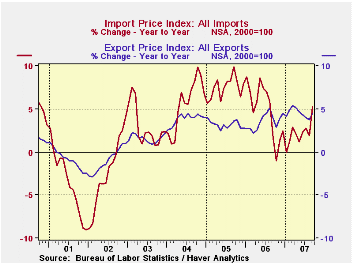 U.S. September import prices jumped 5.4% as petroleum prices surged. Consensus expectations had been for a 1.0% increase.
Some stabilization of that upward pressure seems likely for October since so far in the month, Brent crude oil prices have averaged $77.71 per barrel versus an average of $77.02 last month.
Less petroleum, import price inflation seemed tame posting a 0.2% decline after 0.1% dip in September.
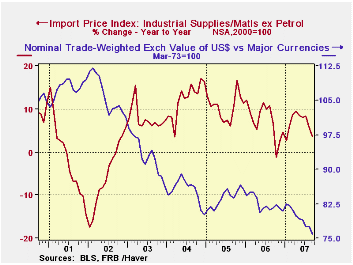
The lower dollar, down by nearly one third since early 2002, may nevertheless be having an effect in raising import prices. During the last ten years there has been a 66% (negative) correlation between the nominal trade-weighted exchange value of the US dollar vs. major currencies and the y/y change in non oil import prices. The correlation is a reduced 47% against a broader basket of currencies.
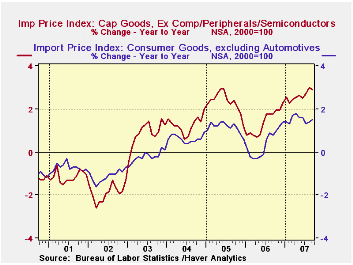
The effect of the lower dollar can be seen in the turnaround in capital goods prices. Less the high tech sector, where prices continue to fall, capital goods prices rose 2.9% y/y in September, an acceleration from the less than one percent gains early last year. Consumer goods prices were rising at a 1.5% y/y rate in September versus a modest deflation of prices as recently as early 2006. Inflation of motor vehicle & parts prices also has picked up to 1.1% from 0.2% early last year.Why a Dollar Depreciation May Not Close the U.S. Trade Deficit from the Federal Reserve Bank of New York is available here.
Prices for industrial supplies & materials excluding petroleum indeed fell 1.4% (+3.6% y/y) as inflation of chemical prices (+3.4% y/y) and iron & steel mill products was under control. In fact, prices for most metal products has decelerated with the downturn in the U.S. housing market. The detailed import price series can be found in the Haver USINT database.
Overall export prices rose 0.3% and annual increases of roughly 4% have been stable for at least the last year. Prices for agricultural products surged 4.1% (23.3% y/y) but nonagricultural export prices were unchanged (2.9% y/y).
A Falling Dollar: Good News or Bad News? from the Federal Reserve Bank of Atlanta can be found here.
| Import/Export Prices (NSA) | September | August | Y/Y | 2006 | 2005 | 2004 |
|---|---|---|---|---|---|---|
| Import - All Commodities | 1.0% | -0.3% | 5.2% | 4.9% | 7.5% | 5.6% |
| Petroleum | 5.4% | -1.1% | 20.1% | 20.6% | 37.6% | 30.5% |
| Non-petroleum | -0.2% | -0.1% | 2.0% | 1.7% | 2.7% | 2.6% |
| Export- All Commodities | 0.3% | 0.2% | 4.5% | 3.6% | 3.2% | 3.9% |
by Robert Brusca October 11, 2007
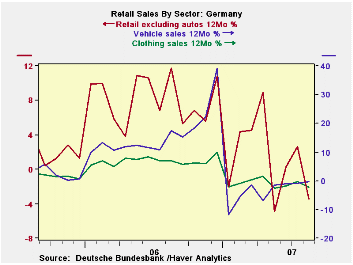
While auto sales have revived in August, the rest of retail sales remain lethargic.In real terms retail sales excluding auto sales fell by 1.6% in August. For the third quarter, sales are off to a weak start as nominal retail sales excluding autos are off at a 0.9% rate; real retail sales excluding autos are off at a 1% annual rate. Food and tobacco plus clothing and footwear categories are off sharply in the new quarter as well. But auto and parts sales are up at a strong 25% annual rate. Since The German VAT was hiked in January retail sales are still hampered.
| German Real and Nominal Retail Sales | New QTR | |||||||
|---|---|---|---|---|---|---|---|---|
| Nominal | Aug-07 | Jul-07 | Jun-07 | 3-MO | 6-MO | 12-MO | YrAgo | SAAR |
| Retail Ex auto | -1.4% | 0.7% | 1.4% | 3.0% | -0.9% | -2.1% | 7.0% | -0.9% |
| MV and Parts | 3.6% | 0.9% | 0.0% | 19.1% | 26.3% | -0.4% | 17.5% | 25.6% |
| Food Bev & Tobacco | -1.2% | -0.1% | 0.8% | -1.8% | -1.8% | -1.3% | 5.1% | -5.4% |
| Clothing footwear | -0.2% | 0.2% | 5.5% | 23.8% | -1.9% | -3.4% | 11.8% | -3.8% |
| Real | ||||||||
| Retail Ex auto | -1.6% | 0.7% | 1.4% | 2.3% | -1.3% | -3.0% | 6.5% | -1.0% |
by Robert Brusca October 11, 2007
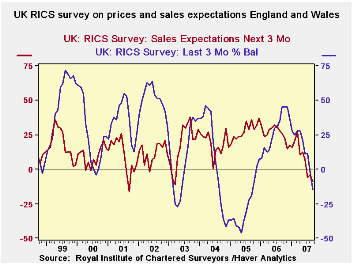 The UK RICs survey is a net balance survey and therefore samples the breadth of gains or drops across the area and dimension surveyed. In September the net balance for prices fell to -15 from -3 in August, a sharp month-to-month drop.Both sales expectations and prices are now dropping. Price expectations are dropping as well and the reading for expectations lies below that for prices, a signal in the past that price reductions could continue for some time.
The RICs assessment for housing is quite negative. It’s the worst since late 2005 for prices and since early 2003 for sales.
| RICS: House Prices and Expectations for Prices and Sales | ||||||
|---|---|---|---|---|---|---|
| Sep-07 | Aug-07 | Jul-07 | 3MoAvg | 6MoAVg | 12MoAvg | |
| Prices | -15 | -3 | 11 | -2 | 9 | 22 |
| Price Expectations | -20 | -13 | -9 | -14 | -5 | 11 |
| Sales expectations | -9 | -4 | -6 | -6 | 2 | 11 |
| New Sales | -28 | -20 | -17 | -22 | -11 | -3 |
by Carol Stone October 11, 2007
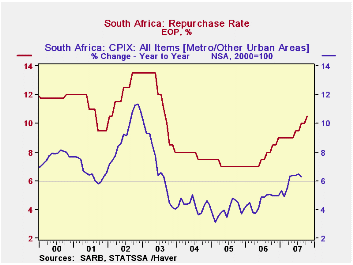
The South African Reserve Bank bucked the current trend among world central banks by tightening monetary policy today. They raised their key policy rate, the repurchase rate, by 50 basis points to 10.50%. The Bank conducts an inflation-target style monetary policy, and the specific CPI measure, "CPIX", has been running above the upper band of the target 3%-6% range since April.
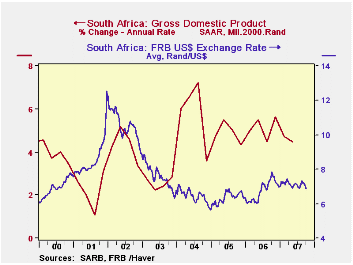
The tightening cycle began in June 2006, when inflation started to move higher and the Bank first became concerned that it was indeed likely to breach the upper end of the target range. This was occurring in the context of consistent economic growth at around a 5% annual rate, but a declining currency, this latter adding to inflation worries, according to the Bank's monetary policy statement at the time. Thus, it raised the key repo rate from 7% to 7.5% and has continued to increase the rate in 0.5% steps to today's 10.5% level.
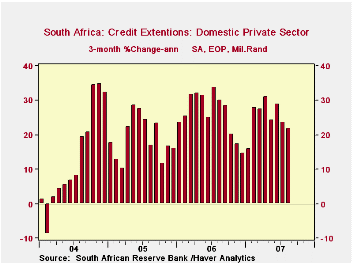
As we browsed the South African data in Haver's EMERGEMA database, we were impressed with the breadth as well as the persistence of good growth trends in the country. Consumer spending has been strong, in excess of 7% growth during 2006 and into 2007, although it has moderated more recently, with "just" 5.5% expansion in Q2 and evidence of some flattening in monthly retail sales. However, capital investment has remained quite vigorous. A nearly 22% rate of expansion in Q1 was hardly sustainable, but the slowing in Q2 still left it at over a 14% annualized pace then. In addition to the real demand growth, credit growth has been rapid. Monetary financial institutions' lending to the "domestic private sector" has been surging at rates of 20% - 25% over the past two years.
Thus, it is not surprising that the central bank would want to take action to rein in inflationary forces. At the same time, they are cognizant of world financial factors as well, and the opening lines of the statement accompanying today's rate hike (found here) indicate that some settling of world markets had the highest priority in their decision-making. They note that the Johannesburg Stock Exchange All Shares Index has reached new highs and that the rand, which had suffered a bit during the worst of the turmoil, has also recovered. They seem then today to be taking advantage of a relatively attractive international financial position presently to get their interest rates where they want them for the longer-term benefit of their domestic economy.
In contrast, the Bank of Japan, in its monetary policy meeting today, determined that it should not rock the boat in the sea of its domestic markets and left its own rates unchanged.
| SOUTH AFRICA: Select Indicators |
Latest | Q2 2007 | Q1 2007 | 2006 | 2005 | 2004 |
|---|---|---|---|---|---|---|
| GDP Growth, SAAR1 | -- | 4.5 | 4.7 | 5.0 | 5.1 | 4.8 |
| Consumption | -- | 5.5 | 7.4 | 7.3 | 6.6 | 6.7 |
| Gross Domestic Fixed Investment | -- | 14.2 | 21.8 | 12.7 | 9.6 | 8.9 |
| Repo Rate | 10.50 | 9.13 | 9.00 | 7.63 | 7.15 | 7.81 |
| CPIX2 Yr/Yr | 6.3 | 6.4 | 5.2 | 4.6 | 3.9 | 4.3 |
| CPI - Food Yr/Yr | 11.3 | 9.1 | 8.0 | 6.7 | 2.1 | 2.0 |
| Credit Growth3 | 22.9 | 24.8 | 24.1 | 25.8 | 19.5 | 13.8 |
1 Quarters are Qtr/Qtr-SAAR; annual figures are based on NSA data
2 CPI excluding mortgage interest rates, the measure used by the Central Bank. Yr/Yr inflation based on NSA data.
3Lending to domestic private sector borrowers

Tom Moeller
AuthorMore in Author Profile »Prior to joining Haver Analytics in 2000, Mr. Moeller worked as the Economist at Chancellor Capital Management from 1985 to 1999. There, he developed comprehensive economic forecasts and interpreted economic data for equity and fixed income portfolio managers. Also at Chancellor, Mr. Moeller worked as an equity analyst and was responsible for researching and rating companies in the economically sensitive automobile and housing industries for investment in Chancellor’s equity portfolio. Prior to joining Chancellor, Mr. Moeller was an Economist at Citibank from 1979 to 1984. He also analyzed pricing behavior in the metals industry for the Council on Wage and Price Stability in Washington, D.C. In 1999, Mr. Moeller received the award for most accurate forecast from the Forecasters' Club of New York. From 1990 to 1992 he was President of the New York Association for Business Economists. Mr. Moeller earned an M.B.A. in Finance from Fordham University, where he graduated in 1987. He holds a Bachelor of Arts in Economics from George Washington University.
More Economy in Brief


