 Global| Oct 31 2003
U.S. After Tax Income Fell
by:Tom Moeller
|in:Economy in Brief
Summary
Personal disposable income fell 1.0% (+4.4% y/y) in September, reversing all of the 1.0% jump the prior month. The decline occurred as the mailing of rebate checks subsided and personal tax payments rose. Tax payments in September [...]
Personal disposable income fell 1.0% (+4.4% y/y) in September, reversing all of the 1.0% jump the prior month. The decline occurred as the mailing of rebate checks subsided and personal tax payments rose. Tax payments in September still were below the June level.
A report titled "Earnings Inequality and Earnings Mobility in the U.S." from the Federal Reserve Bank of San Francisco is available here.
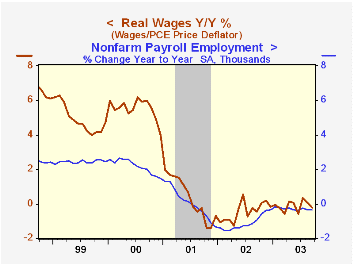
Wages and salaries rose just 0.1% (1.8% y/y) following an upwardly revised 0.2% August gain. During the last twenty years there has been a 73% correlation between the y/y growth in wages and the growth in personal consumption expenditures.
Consumer spending fell a greater than expected 0.3% (5.8% y/y) as personal spending on durable goods slumped 5.1% (+6.1% y/y). Sales of light vehicles fell 12.0% m/m to 16.59M units. Spending on nondurable goods rose 0.3% (7.8% y/y) and services spending rose 0.4% (4.8% y/y).
The PCE price deflator gained 0.2%. Less food and energy prices rose 0.1% (1.2% y/y) for the second month. The durables' price deflator fell 0.5% (-3.7% y/y) and continued a slide that began in early 1995. Nondurables prices rose 0.6% (2.3% y/y) for the second month and services prices rose 0.2% (3.0% y/y).
Research from the Federal Reserve Bank of New York "On Both Sides of the Quality Bias in Price Indexes" is available here.
The savings rate fell to 2.9% as disposable income fell.
| Disposition of Personal Income | Sept | Aug | Y/Y | 2002 | 2001 | 2000 |
|---|---|---|---|---|---|---|
| Personal Income | 0.3% | 0.3% | 3.2% | 2.7% | 3.3% | 8.0% |
| Personal Consumption | -0.3% | 1.1% | 5.8% | 4.5% | 4.5% | 7.0% |
| Savings Rate | 2.9% | 3.5% | 4.0% | 3.7% | 2.3% | 2.8% |
| PCE Price Deflator | 0.2% | 0.3% | 2.0% | 1.4% | 2.0% | 2.5% |
by Tom Moeller October 31, 2003
The Chicago Purchasing Managers Business Barometer for October rose to 55.0 from 51.2 in September. The rise matched Consensus expectations for a reading of 55.0.
Most of the component indexes recovered from the declines of a month earlier. Production (62.0) and orders (59.2) were strong and employment (53.1) rose to the highest level since January 2000.
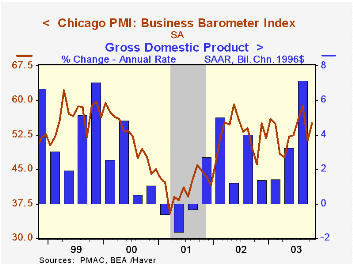
During the last twenty years there has been a 57% correlation between the level of the Chicago PMI and quarterly growth in real GDP.
The index of prices paid jumped to 61.5, the highest level since March.
| Chicago Purchasing Managers Index, SA | Oct | Sept | Y/Y | 2002 | 2001 | 2000 |
|---|---|---|---|---|---|---|
| Business Barometer | 55.0 | 51.2 | 46.1 | 52.7 | 41.4 | 51.8 |
| New Orders | 59.2 | 53.2 | 51.3 | 56.3 | 42.3 | 53.1 |
| Prices Paid | 61.5 | 51.8 | 63.8 | 56.9 | 50.4 | 65.6 |
by Tom Moeller October 31, 2003
The University of Michigan’s consumer sentiment index rose for the full month of October to 89.6 versus 87.7 in September. That reading was marginally better than the mid-month reading of 89.4 and Consensus expectations for 89.5.
The m/m increase was comparable to the gain in the Conference Board's Index of Consumer Confidence.
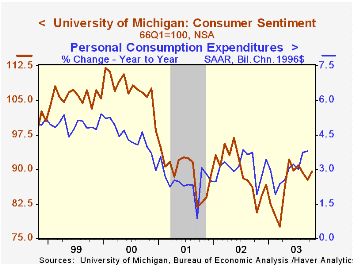
During the last ten years there has been a 70% correlation between the level of consumer sentiment and the y/y change in real PCE.
The current conditions index rose to a revised 99.9 from 98.4 in September. The expectations index rose to 83.0 from 80.8. Mid month, the current conditions index was reported at 102.2, and the expectations index was reported at 81.2.
The University of Michigan survey is not seasonally adjusted.It is based on telephone interviews with 250 households nationwide on personal finances and business and buying conditions. The survey is expanded to a total of 500 interviews at month end.
| University of Michigan | Oct | Sept | Aug | Y/Y | 2002 | 2001 | 2000 |
|---|---|---|---|---|---|---|---|
| Consumer Sentiment | 89.6 | 87.7 | 89.3 | 11.2% | 89.6 | 89.2 | 107.6 |
| Current Conditions | 99.9 | 98.4 | 99.7 | 8.1% | 97.5 | 100.1 | 115.2 |
| Consumer Expectations | 83.0 | 80.8 | 82.5 | 13.5% | 84.6 | 82.3 | 102.7 |

Tom Moeller
AuthorMore in Author Profile »Prior to joining Haver Analytics in 2000, Mr. Moeller worked as the Economist at Chancellor Capital Management from 1985 to 1999. There, he developed comprehensive economic forecasts and interpreted economic data for equity and fixed income portfolio managers. Also at Chancellor, Mr. Moeller worked as an equity analyst and was responsible for researching and rating companies in the economically sensitive automobile and housing industries for investment in Chancellor’s equity portfolio. Prior to joining Chancellor, Mr. Moeller was an Economist at Citibank from 1979 to 1984. He also analyzed pricing behavior in the metals industry for the Council on Wage and Price Stability in Washington, D.C. In 1999, Mr. Moeller received the award for most accurate forecast from the Forecasters' Club of New York. From 1990 to 1992 he was President of the New York Association for Business Economists. Mr. Moeller earned an M.B.A. in Finance from Fordham University, where he graduated in 1987. He holds a Bachelor of Arts in Economics from George Washington University.
More Economy in Brief


