 Global| Mar 05 2009
U.S. 4Q Worker Productivity Revised Down Sharply
by:Tom Moeller
|in:Economy in Brief
Summary
During last year's fourth quarter, labor productivity in the nonfarm business sector fell 0.4% (AR), revised down sharply from last month's indication of a 3.2% increase. The downward revision to 4Q08, however, was offset by upward [...]
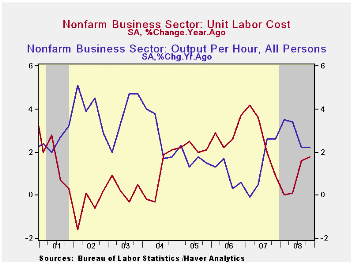
During last year's fourth quarter, labor productivity in the nonfarm business sector fell 0.4% (AR), revised down sharply from last month's indication of a 3.2% increase. The downward revision to 4Q08, however, was offset by upward revisions to prior quarters and for the year, growth was left unchanged at 2.8%, double the gain during all of 2007. The 4Q decline fell short of Consensus expectations for a revision to a 1.5% increase.
Growth in 4Q compensation totaled 5.3% which was upwardly revised from the 5.0% gain indicated last month. That increase bought annual growth in compensation to 3.7% from 4.1% in 2007. Annually, growth in compensation has been quite stable at or slightly below 4% since 2001.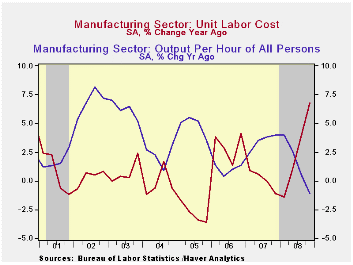
Growth in unit labor costs accelerated sharply last quarter as a result of the productivity revision. It was raised to 5.7% from the 1.8% gain indicated initially. However, though that increase raised growth for the whole year to 0.9% from the 0.5% increase indicated last month, it was still near the weakest in five years.
The downward revision to productivity growth stemmed from a deepened decline in output, now pegged at -8.7%. For the year, however, growth in output was left about unchanged at 0.8% which was the weakest since the recession of 2001. Hours worked fell by an unrevised 8.4% rate last quarter and 1.9% for the full year.
In the factory sector, productivity declined at a little revised 4.0% rate last quarter which was deeper than the rate of decline during the prior two quarters. For the year as a whole, however, manufacturing productivity did rise 1.5%. A decline of 2.5% is in the offing for 2009 due to the recession. Unit labor cost growth in the factory sector surged at a little revised 14.7% rate last quarter as a result of the sharp decline in productivity and it rose at a quickened 2.6% rate for the year. Compensation growth about doubled last quarter to 10.1% and it rose a quickened 4.1% for the whole year.
The productivity & cost figures are available in Haver's USECON database.
Discussion of “Oil and the Macroeconomy: Lessons for Monetary Policy" by San Francisco Fed President Janet L. Yellen is available here.
| Nonfarm Business Sector (SAAR, %) | 4Q '08 | 3Q '08 | Y/Y | 2008 | 2007 | 2006 |
|---|---|---|---|---|---|---|
| Output per Hour | -0.4 | 2.2 | 2.2 | 2.8 | 1.4 | 0.9 |
| Compensation per Hour | 5.3 | 5.7 | 4.1 | 3.7 | 4.1 | 3.8 |
| Unit Labor Costs | 5.7 | 3.5 | 1.8 | 0.9 | 2.7 | 2.8 |
by Tom Moeller March 5, 2009
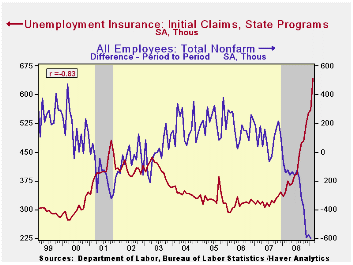
Weakness in the U.S. labor market eased slightly last week. A 31,000 decline in initial claims for unemployment insurance reversed the gain recorded in the prior week, which had brought claims to a level not seen since 1982. The Labor Department indicated that initial claims for unemployment insurance fell last week to 639,000 from 670,000, a higher figure than initially reported. The latest reading was lower than Consensus expectations for 650,000 initial claims.
The Labor Department will release the February payroll employment figures tomorrow. For last month, claims averaged 642,000 versus the January average of 561,000. During the last ten years there has been an 83% correlation between the level of initial claims and the month-to-month change in nonfarm payrolls.
In the week ending February 21 the largest increases in claims were in Illinois (+3,791), Massachusetts (+3,438), Missouri (+3,027), Ohio (+2,731), and California (+2,677), while the largest decreases were in Florida (-3,586), Virginia (-3,490), New York (-3,420), Michigan (-3,373), and New Jersey (-2,266).
Continuing claims for unemployment insurance eased a slight 14,000 after two weeks of triple digit increase. At 5,106,000, the level of continuing claims remained near the record level. The series dates back to 1966. The four-week average of continuing claims rose 76,800 to 5,011,000. Continuing claims provide some indication of workers' ability to find employment and they lag the initial claims figures by one week.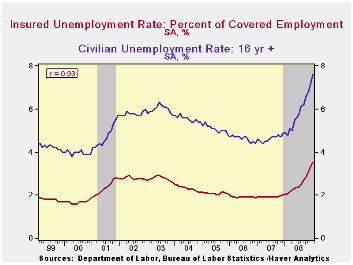
Though the latest level of continuing claims was a record, the labor force has grown as well, by nearly 30% over the last twenty years. Therefore, the insured rate of unemployment was not at a new record and it remained stable week-to-week at 3.8% which was the highest since 1983. During the last ten years there has been a 93% correlation between the level of the insured unemployment rate and the overall rate of unemployment published by the Bureau of Labor Statistics. The highest insured rates of unemployment in the week ending February 14 were in Michigan (8.2 percent), Oregon (7.3), Idaho (7.1), Pennsylvania (6.7), Wisconsin (6.5), Rhode Island (6.2), Alaska (6.0), Nevada (6.0), Montana (5.8), and Puerto Rico (5.8).
The unemployment insurance claim data is available in Haver's WEEKLY database.
The Fed's latest Beige Book covering regional economic conditions can be found here.
| Unemployment Insurance (000s) | 02/28/09 | 02/21/09 | 02/14/09 | Y/Y | 2008 | 2007 | 2006 |
|---|---|---|---|---|---|---|---|
| Initial Claims | 639 | 670 | 631 | 85.8% | 420 | 321 | 313 |
| Continuing Claims | -- | 5,106 | 5,120 | 81.8% | 3,342 | 2,552 | 2,459 |
by Tom Moeller March 5, 2009
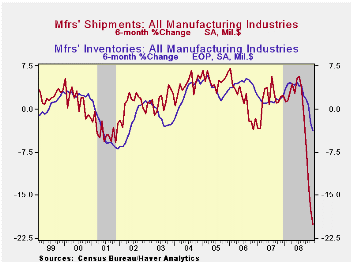
Factory inventory levels continued to plummet during January. The 0.8% monthly decline was the fifth in a row and lowered inventories by 4.5% from their August peak. To be sure, these figures have been influenced by the decline in oil prices. However, excluding oil, factory inventories are down 1.2% from their peak, a decline not seen since 2003.
Lower inventories of automobiles have dominated the factory inventory decline. They fell 17.6% in January and by 20.0% over the last three months. Steep production cutbacks pulled furniture inventories down 5.2% over the last six months while inventories of electrical equipment are down 7.2% since September. 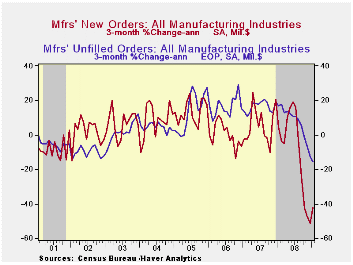
Weaker factory shipments have prompted the inventory cutbacks with a 15.6% decline over the last year. Again, lower oil prices account for much of the decline but less oil, factory shipments have fallen 13.9% from their peak last July. Automobile shipments were off by more 36.1% from their summer peak while shipments of electrical equipment fell 19.8% during that period. Shipments of furniture & related products fell 16.2% since the summer.
Total factory orders dropped 1.9% during January. The capital goods sector has been notably hard hit. Machinery orders dropped 3.0% in January and by 29.1% during the last six months. Orders for electrical equipment fell 7.3% during January alone and by 19.6% since July.
The Manufacturers' Shipments, Inventories and Orders (MSIO) data is available in Haver's USECON database.
| Factory Survey (NAICS, %) | January | December | Y/Y | 2008 | 2007 | 2006 |
|---|---|---|---|---|---|---|
| Inventories | -0.8 | -1.9 | 0.0 | 2.1 | 3.7 | 8.2 |
| Excluding Transportation | -0.8 | -2.8 | -2.7 | -0.6 | 2.7 | 7.9 |
| New Orders | -1.9 | -4.9 | -19.2 | 0.1 | 1.9 | 6.2 |
| Excluding Transportation | -0.9 | -4.4 | -16.6 | 3.1 | 1.2 | 7.4 |
| Shipments | -1.7 | -3.3 | -15.6 | 1.7 | 1.2 | 5.9 |
| Excluding Transportation | -1.6 | -3.9 | -14.6 | 3.7 | 1.5 | 6.7 |
| Unfilled Orders | -1.7 | -1.5 | 1.2 | 3.5 | 17.1 | 15.3 |
| Excluding Transportation | -2.1 | -2.5 | -3.8 | -1.0 | 8.2 | 16.0 |

Tom Moeller
AuthorMore in Author Profile »Prior to joining Haver Analytics in 2000, Mr. Moeller worked as the Economist at Chancellor Capital Management from 1985 to 1999. There, he developed comprehensive economic forecasts and interpreted economic data for equity and fixed income portfolio managers. Also at Chancellor, Mr. Moeller worked as an equity analyst and was responsible for researching and rating companies in the economically sensitive automobile and housing industries for investment in Chancellor’s equity portfolio. Prior to joining Chancellor, Mr. Moeller was an Economist at Citibank from 1979 to 1984. He also analyzed pricing behavior in the metals industry for the Council on Wage and Price Stability in Washington, D.C. In 1999, Mr. Moeller received the award for most accurate forecast from the Forecasters' Club of New York. From 1990 to 1992 he was President of the New York Association for Business Economists. Mr. Moeller earned an M.B.A. in Finance from Fordham University, where he graduated in 1987. He holds a Bachelor of Arts in Economics from George Washington University.
More Economy in Brief


