 Global| Mar 20 2009
U.S. 2008 Current Account Deficit Shrinks To Smallest Since 2004
by:Tom Moeller
|in:Economy in Brief
Summary
Recession and lower oil prices worked to sharply shrink the U.S. current account deficit last year. In fact, the 2008 deficit of $673.3 billion was the smallest since 2004. That improvement came despite recessions abroad which limited [...]
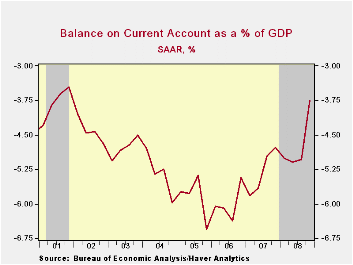
Recession and lower oil prices worked to sharply shrink the U.S. current account deficit last year. In fact, the 2008 deficit of $673.3 billion was the smallest since 2004. That improvement came despite recessions abroad which limited U.S. exports. Indeed, lower oil prices were at work lowering the cost of imports and the 4Q deficit of $132.8 billion was shallower than the Consensus expectation for a reading of $137.5 billion.
As a percentage of GDP, the shrinkage of the U.S. deficit was even more dramatic. The 4.7% figure for all of last year was the smallest since 2002, the Commerce Department indicated Wednesday. This percentage is well reduced from the 6.6% peak reached late in 2005.
Recession in the U.S. worked with the decline in oil prices to drop the 4Q deficit on traded goods to $174.1 billion, its lowest since 2004. Though growth in goods exports was negative 4.2% y/y, imports fell by a greater 9.3%.
Fewer U.S. citizens went abroad this year and more came here. As a result, the balance on services trade narrowed by the end of 2008 as exports fell more then imports. The 4Q surplus of $33.7B. compared to a peak surplus of $36.5B during 2Q. That decline came as exports fell 5.1% against a 5.3% decline in imports. Nevertheless, for the year as a whole the lower dollar helped raise travel exports (foreign citizens spending more in the U.S.) and services exports grew 17.3% y/y while services imports fell 9.0% during 2008.
From the capital account, the deficit on U.S. private direct investment again grew during 4Q as U.S. investment fell but foreign investment rose. For the year as a whole, the deficit of $643B was by far a record as U.S. citizens invested less abroad.
The Financial Crisis and Community Banking is today's speech by Fed Chairman Ben S. Bernanke and it is available here.
Ties that bind: bilateral trade's role in synchronizing business cycles from the Federal Reserve Bank of Dallas can be found here.
| US Balance of Payments SA | 4Q '08 | 3Q '08 | Year Ago | 2008 | 2007 | 2006 |
|---|---|---|---|---|---|---|
| Current Account Balance ($ Bil.) | -132.8 | -181.3 | -167.2 | -673.3 | -731.2 | -788.1 |
| Deficit % of GDP | 3.7 | 5.0 | 5.0 | 4.7 | 5.3 | 6.0 |
| Balance on Goods ($ Bil.) | -174.1 | -216.3 | -208.9 | -820.8 | -819.4 | -838.3 |
| Exports | -16.1% | 2.7% | -4.2% | 12.4% | 12.3% | 14.4% |
| Imports | -17.4% | 1.4% | -9.3% | 7.3% | 5.7% | 10.7% |
| Balance on Private Services ($ Bil.) | 33.7 | 35.4 | 35.1 | 139.7 | 119.1 | 85.0 |
| Exports | -5.1% | 1.0% | 0.2% | 9.5% | 14.6% | 11.5% |
| Imports | -5.3% | 2.4% | 8.4% | 1.7% | 8.4% | 11.3% |
| Balance on Income ($ Bil.) | 36.5 | 29.6 | 36.2 | 127.6 | 81.8 | 57.2 |
| Unilateral Transfers ($ Bil.) | -28.9 | -30.0 | -29.8 | -119.7 | -112.7 | -92.0 |
by Robert Brusca March 20, 2009
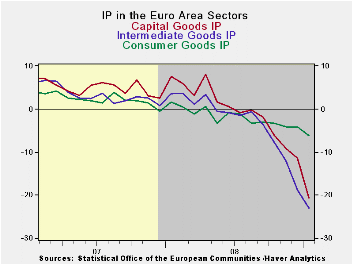
It is the largest drop in e-Zone IP since records have been
kept. Intermediate goods, capital goods and consumer goods output
trends are being clobbered. Each sector is worsening sequentially. Each
of the countries displayed: Germany, France, Italy, and the UK, is
experiencing sequentially worsening rates of growth for their selected
measures of IP.
It is getting worse. The EU is in the belly of the beast and
beast is recession.
Statements for Germany today confirm that things are getting worse there and that there are no signs of a turnaround. In France INSEE is now looking for Q1-2009 to be weaker than Q4-2008. In France despite the lobbying Sarkozy has done for more stimulus and relaxation within the Area, French workers are striking as if he could DO SOMETHING about the severity of the recession. They are in fact wanting him to do more to mitigate it. But France, like other EMU members, has to be mindful of the Maastricht rules that apply to budget deficits. Europeans, despite seeing this worsening in their respective economies, are amazingly blasé about doing more to mitigate the effects. Moreover, within the Group of 20 European member are far more interested in rules and regulations for the future than in dealing with current issues. If they were firemen they’d be calling in the arson investigators instead of dousing the still-raging and expanding flames. Europeans are different.
| E-zone MFG IP | ||||||||||
|---|---|---|---|---|---|---|---|---|---|---|
| Saar except m/m | Mo/Mo | Jan 09 |
Dec 08 |
Jan 09 |
Dec 08 |
Jan 09 |
Dec 08 |
|||
| E Area Detail | Jan 09 |
Dec 08 |
Nov 08 |
3Mo | 3Mo | 6mo | 6mo | 12mo | 12mo | Q-1 |
| Consumer | -1.3% | -0.3% | -0.9% | -9.2% | -5.0% | -7.0% | -5.6% | -6.2% | -4.1% | -9.9% |
| C-Durables | -2.6% | -2.6% | -3.4% | -29.6% | -25.8% | -21.0% | -19.8% | -17.2% | -12.4% | -- |
| C-Non-durables | -1.1% | 0.4% | -0.8% | -6.2% | -0.6% | -3.6% | -3.1% | -4.7% | -2.4% | -- |
| Intermediate | -3.6% | -6.0% | -4.2% | -43.1% | -42.1% | -33.3% | -29.2% | -23.1% | -18.8% | -42.6% |
| Capital | -6.0% | -2.6% | -3.2% | -38.2% | -28.6% | -27.7% | -19.3% | -20.6% | -11.4% | -41.8% |
| Main E-zone Countries and UK IP in MFG | ||||||||||
| Mo/Mo | Jan 09 |
Dec 08 |
Jan 09 |
Dec 08 |
Jan 09 |
Dec 08 |
||||
| MFG Only | Jan 09 |
Dec 08 |
Nov 08 |
3Mo | 3Mo | 6mo | 6mo | 12mo | 12mo | Q-2- Date |
| Germany: | -8.5% | -4.8% | -4.2% | -51.4% | -36.4% | -33.7% | -23.1% | -20.7% | -12.2% | -55.9% |
| France: IPxConstruct'n | -3.1% | -1.5% | -2.8% | -26.0% | -27.1% | -21.3% | -15.3% | -13.8% | -10.2% | -26.6% |
| Italy | -0.2% | -2.7% | -3.2% | -21.9% | -28.1% | -20.7% | -22.8% | -14.6% | -13.1% | -17.2% |
| Spain | -8.4% | 3.8% | -9.5% | -45.1% | -29.8% | -38.0% | -8.2% | -23.7% | -15.5% | -44.0% |
| UK: EU member | -2.8% | -1.9% | -3.0% | -26.8% | -22.9% | -19.9% | -15.9% | -12.8% | -10.0% | -26.4% |

Tom Moeller
AuthorMore in Author Profile »Prior to joining Haver Analytics in 2000, Mr. Moeller worked as the Economist at Chancellor Capital Management from 1985 to 1999. There, he developed comprehensive economic forecasts and interpreted economic data for equity and fixed income portfolio managers. Also at Chancellor, Mr. Moeller worked as an equity analyst and was responsible for researching and rating companies in the economically sensitive automobile and housing industries for investment in Chancellor’s equity portfolio. Prior to joining Chancellor, Mr. Moeller was an Economist at Citibank from 1979 to 1984. He also analyzed pricing behavior in the metals industry for the Council on Wage and Price Stability in Washington, D.C. In 1999, Mr. Moeller received the award for most accurate forecast from the Forecasters' Club of New York. From 1990 to 1992 he was President of the New York Association for Business Economists. Mr. Moeller earned an M.B.A. in Finance from Fordham University, where he graduated in 1987. He holds a Bachelor of Arts in Economics from George Washington University.
More Economy in Brief


