 Global| Mar 23 2017
U.K. Retail Looks Less Bulletproof; BOE's Next Move May Not Be As Clear Cut As You Think
Summary
For the most part, the assessments embodied in the March survey from the UK's CBI (Confederation of British Industry) are being taken as being upbeat. But I see a bit too much complacency in that spin. Reported sales, compared to one [...]
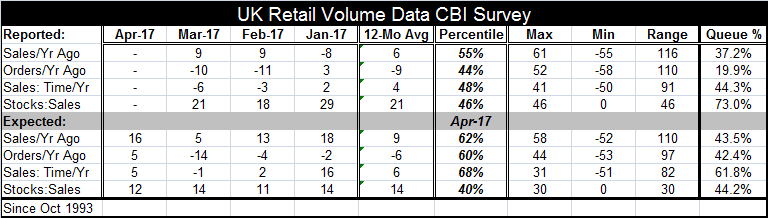
 For the most part, the assessments embodied in the March survey from the UK's CBI (Confederation of British Industry) are being taken as being upbeat. But I see a bit too much complacency in that spin. Reported sales, compared to one year ago did post a 9 net diffusion reading, the same as in January and strongly up from December's -8. But a bit more perspective than that puts most of the responses to this survey in the less-than-desirable category. Let's take a closer look.
How to assess a diffusion index report
My preferred demystification of this survey and of most diffusion-type surveys is to reject the implicit survey device of seeing a positive number (up-minus down responses in net diffusion terms) as unambiguously good. In terms of the responses in the table, most of the diffusion readings are positive, indicating that more firms are saying that things are good rather than bad or growing faster rather than slower or something of that nature depending on the category. But I provide a queue ranking at the far right that simply looks at each category's net responses since October 1993 and ranks this month's response in the entire queue, expressing the result as a percentile standing. For this rank or queue standing metric, the 'neutral reading is at 50% because that represents each category's median. A higher standing is better than the median; a lower standing is weaker than the median. To me, a reading above a category's median is a positive and readings below the medians are negative. The idea here is simple. I am looking to compare each category to a view or normalcy or 'average' defined by the median instead of the 'average'.
The status of conditions as reported
Looking at the top grid in the table concerning reported conditions, we find all indicators are below their respective 50% levels except inventories (inventories relative to sales). That item is at a 73 percentile standing and that may not be a good thing. Firms do not want to be holding a larger than normal pile of inventory when sales compared to a year ago and orders compared to a year ago and sales 'for-this-time-of-year' all are below their respective medians as they are in March. Orders are especially weak at a 19.9 percentile standing. Sales compared to a year ago are at a 37 percentile standing, above their bottom one third by only a small margin. And sales for-this-time-of-year have a 44 percentile standing, short of but not too far from their historic median. Note that only sales compared to one year ago are significantly stronger than their 12-month average. Also note that the raw diffusion reading for stocks has been rising and is only at its 12-month average despite its higher queue standing. Appreciate that the queue ranking method is superior than just looking at diffusion values which otherwise would having you seeing 'good ' sales and stock responses and 'bad' order and sales-for-this-time-of year responses. The queue method also permits us to make meaningful comparisons across categories, not just within them. In fact, orders on the queue method are quite a bit weaker than anything else and sales for this-time-of-year are actually stronger in their queue ranking than sales compared to one year ago despite the much lower diffusion reading for the time-of-year metric.
Theory and reason for rank relativity
Another way of making this point is to accept that diffusion is not universal and was not brought down from the Mount by Mosses written on stone tablets. Instead, each category has its own idiosyncratic tendencies for diffusion and for that reason each category should be judged relative to its own history and its own characteristics. For example, for the upper part of the table (reported), the highest standard deviation is by category is 20.9 for year-over-year sales while the least volatile category is stocks which only have a standard deviation of 6.2. Clearly, we would not want to treat a one-month six-point move in the inventory metric (where such a move would be a near record) to a six-point move in year-over-year sales. Sales also have the highest mean at 14 while the lowest mean is for sales for-this-time-of-year at -4. For whatever reason, businesses are somewhat pessimistic when assessing the strength of sales discounted for the particular time of year.
Expectations
Expectations for April show all categories have higher queue standings than in March (compared to expectations or to 'reported or current' results) except that stocks relative to sales are expected to back off in April. This underscores what we just observed in real time: that inventories in March are relatively high while sales are relatively softer. In response, merchants in April are planning to reduce the ratio of stocks to sales. They see a strong step up in sales coming in April compared to a year ago and in orders compared to a year ago and on sales relative to 'this-time-of-year.' U.K. merchant expectations are to the upside as the rank standing of each category (except stocks relative to sales) is higher than for its analog real time (or 'reported') standing in March. Merchants see sales and orders picking up and they plan to use some of this move to reduce inventory-to-sales ratios. Note that for the expectations series all are still below the 50% level in April except sales for-this-time-of-year.
Comparing the survey to actual sales volumes
In the chart, we plot U.K. retail sales volume vs. the sales expectation (for sales relative to one year ago). Note that expected sales have been chopping around an unchanged reading for a number of months while actual retail volumes had been quite strong until the last several months when volume growth has been sharply reduced.
BOE has a confusing decision to make
These trends put the BOE in a bit of a pickle. Inflation has ticked up and even broken above the Bank's 2% target for it. Yet, there are signs of a slowdown for retail sales volume and even from the CBI survey itself if you put it through the right sort of filter. The BOE had been leaning on the side of providing more stimulus in the wake of the Brexit vote and its aggressive easing pushed the pound sharply lower. Sterling weakness plus oil are an important part of the reason for inflation moving up. But firms also are moving out in anticipation of Brexit. Goldman Sachs has announced it is moving hundreds out of London and is invoking its adjustment plan rather than waiting to see what comes of the Brexit negotiations. If Goldman is any sort of a bellwether, it suggests that inflation pressures might be short-lived as outmigration takes hold and deflates domestic pressures further. We already see some weakness here in retail sales. Still, sterling remains weak and stimulative to industry located in the UK. But the UK is caught in a swirl of cross currents and even Odysseus found that choosing his path between the rages of Scylla or the swirling Charybdis was a lose/lose proposition. It would not be surprising if the BOE simply did not know which way to turn and stayed on hold for an extended period of time. Risks are hard to discount in this environment. Sometimes doing nothing is optimal.

Robert Brusca
AuthorMore in Author Profile »Robert A. Brusca is Chief Economist of Fact and Opinion Economics, a consulting firm he founded in Manhattan. He has been an economist on Wall Street for over 25 years. He has visited central banking and large institutional clients in over 30 countries in his career as an economist. Mr. Brusca was a Divisional Research Chief at the Federal Reserve Bank of NY (Chief of the International Financial markets Division), a Fed Watcher at Irving Trust and Chief Economist at Nikko Securities International. He is widely quoted and appears in various media. Mr. Brusca holds an MA and Ph.D. in economics from Michigan State University and a BA in Economics from the University of Michigan. His research pursues his strong interests in non aligned policy economics as well as international economics. FAO Economics’ research targets investors to assist them in making better investment decisions in stocks, bonds and in a variety of international assets. The company does not manage money and has no conflicts in giving economic advice.
More Economy in Brief


