 Global| Sep 01 2009
Three Weeks Of "Cash for Clunkers"Program Spurs August U.S. Vehicle Sales To Highest Since May 2008
by:Tom Moeller
|in:Economy in Brief
Summary
The U.S. government's "Cash for Clunkers" (CARS) program was in full force during the final three weeks of last month. The program gave car buyers up to $4,500 for trading in older, gas-guzzling vehicles if they bought more fuel [...]
The U.S. government's "Cash for Clunkers" (CARS) program was
in full force during the final three weeks of last month. The program
gave car buyers up to $4,500 for trading in older, gas-guzzling
vehicles if they bought more fuel efficient cars & light
trucks. An estimated 700,000 clunkers were taken off the road (to be
scrapped) and replaced by more fuel efficient vehicles. The program
cost the Federal Government $2.877 billion. Indeed, the CARS program
seems to have stimulated sales of new vehicles. 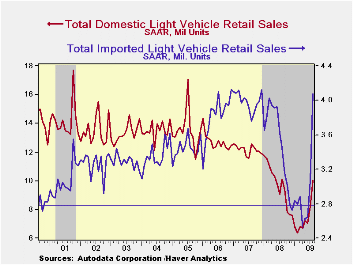 U.S. unit
sales of light vehicles during August jumped 25.4% m/m to
14.09M units which was their highest since May of 2008, according to
the Autodata Corporation. (Seasonal adjustment of the figures is
provided by the U.S. Bureau of Economic Analysis). August sales were
indeed higher than the expected 13.2M sales rate. The question now is
to what degree these sales borrowed from the future?
U.S. unit
sales of light vehicles during August jumped 25.4% m/m to
14.09M units which was their highest since May of 2008, according to
the Autodata Corporation. (Seasonal adjustment of the figures is
provided by the U.S. Bureau of Economic Analysis). August sales were
indeed higher than the expected 13.2M sales rate. The question now is
to what degree these sales borrowed from the future?
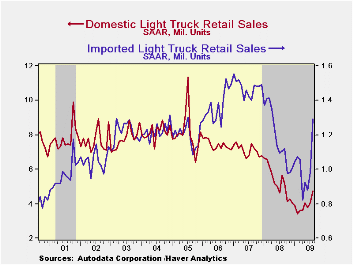
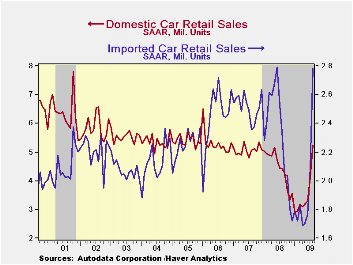
Sales of domestically made vehicles jumped 22.6% m/m to 10.02M units but they still were down 0.9% y/y. Sales of fuel efficient cars rose 28.0% m/m and that lifted them by 18.7% y/y. Light truck sales posted a 17.1% m/m gain that still left them down 16.3% versus last August. Year-to-date, sales of domestic vehicles overall are up 31.5% following last year's 35.8% drop from December-to-December.
 Imported light vehicles similarly
benefitted from the government's sales program. A 32.9% m/m rise to
4.08M units actually exceeded the sales gain for domestics and brought
them up 18.1% y/y. Sales of imported autos rose by more than one-third
from July and were at their highest level since last June. Sales of
imported light trucks similarly rose by nearly one-third m/m and rose
16.7% y/y. Year-to-date sales of imported vehicles rose by nearly
one-half following last year's 33.9% decline.
Imported light vehicles similarly
benefitted from the government's sales program. A 32.9% m/m rise to
4.08M units actually exceeded the sales gain for domestics and brought
them up 18.1% y/y. Sales of imported autos rose by more than one-third
from July and were at their highest level since last June. Sales of
imported light trucks similarly rose by nearly one-third m/m and rose
16.7% y/y. Year-to-date sales of imported vehicles rose by nearly
one-half following last year's 33.9% decline.
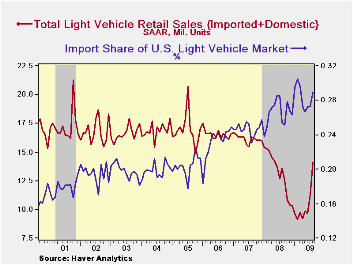
Overall, import's share of the U.S. light vehicle market rose to 28.9% last month after reaching 26.5% during all of last year. (Imported vehicles are those produced outside the United States.) Imports' share of the U.S. car market totaled 34.6%, versus 34.3% last year while the share of the light truck market was 21.4%, up from 18.3 % last year.
 By maker, GM car sales in August fell 4.6%
from last August but Ford's sales rose 24.9% y/y. Chrysler sales fell
13.0% but sales of Toyotas rose a strong 19.7%. Sales of Nissan autos
jumped 38.4% while Subaru car sales soared 54.7%. Sales of the high-end
Mercedes autos fell 17.5% y/y and sales of BMW's were off 16.3%. In the
light truck market, GM's sales fell by nearly one-third y/y but Ford's
sales increased 12.9%. Chrysler's truck sales fell 16.2% and Toyota
truck sales similarly fell 14.6%. Sales of Nissan's light trucks were
off by nearly one-half versus last August but Subaru's sales rose by
nearly one-half.
By maker, GM car sales in August fell 4.6%
from last August but Ford's sales rose 24.9% y/y. Chrysler sales fell
13.0% but sales of Toyotas rose a strong 19.7%. Sales of Nissan autos
jumped 38.4% while Subaru car sales soared 54.7%. Sales of the high-end
Mercedes autos fell 17.5% y/y and sales of BMW's were off 16.3%. In the
light truck market, GM's sales fell by nearly one-third y/y but Ford's
sales increased 12.9%. Chrysler's truck sales fell 16.2% and Toyota
truck sales similarly fell 14.6%. Sales of Nissan's light trucks were
off by nearly one-half versus last August but Subaru's sales rose by
nearly one-half.
The U.S. vehicle sales figures can be found in Haver's USECON database and the company sales figures are in the INDUSTRY database.
Economy to turn the corner in 2010 from the Federal Reserve Bank of Chicago is available here.
| Light Vehicle Sales (SAAR, Mil. Units) | August | July | June | August Y/Y | 2008 | 2007 | 2006 |
|---|---|---|---|---|---|---|---|
| Total | 14.09 | 11.24 | 9.70 | 3.9% | 13.17 | 16.16 | 16.54 |
| Autos | 8.05 | 6.20 | 5.04 | 18.7 | 6.71 | 7.58 | 7.77 |
| Domestic | 5.26 | 4.11 | 3.28 | 18.7 | 4.42 | 5.07 | 5.31 |
| Imported | 2.78 | 2.09 | 1.76 | 18.8 | 2.29 | 2.52 | 2.45 |
| Light Trucks | 6.05 | 5.04 | 4.66 | -10.9 | 6.47 | 8.60 | 8.78 |
| Domestic | 4.75 | 4.06 | 3.78 | -16.3 | 5.29 | 7.10 | 7.42 |
| Imported | 1.29 | 0.98 | 0.88 | 16.7 | 1.18 | 1.47 | 1.37 |
ADP Report: Rate of Job Loss Continues to Moderate, But Slowly
by Tom Moeller September 2, 2009
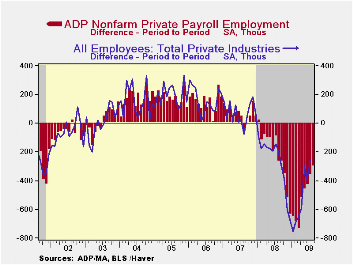
It's part of a slowly developing trend, but the rate of job loss moderated again last month. The latest report from the payroll processor ADP, in their National Employment Report, indicated that private nonfarm payrolls fell 298,000 during August after a revised 360,000 July decline that was slightly shallower than reported initially. The latest reading was the nineteenth consecutive monthly decline, but the monthly change was the smallest since October of last year and less than half the worst of this past March. The three-month annualized rate of decline in payrolls also eased to 3.9% from its March peak of 7.1%.
ADP compiled the estimate from its database of individual companies' payroll information. Macroeconomic Advisers, LLC, the St. Louis economic consulting firm, developed the methodology for transforming the raw data into an economic indicator.
The U.S. Bureau of Labor Statistics will report August payroll employment this Friday. For comparison, July's 360,000 worker decline in ADP's measure of private nonfarm payrolls was accompanied by a loss of 254,000 jobs in the BLS measure of private sector payrolls. According to ADP and Macro-Advisers, the correlation between the monthly percentage change in the ADP estimate and that in the BLS data is 0.90.ADP reported that small-sized payrolls fell the most last month and posted a 122,000 decline (-4.4%). That was similar to the 116,000 (-5.8% y/y) decline in medium-sized payrolls. Large payrolls fell by 60,000 (-5.6% y/y). The steady decline in service-producing industry employment continued. The 146,000 (-3.3% y/y) drop was the seventeenth consecutive monthly decline but in percentage terms the three-month rate of change moderated slightly to -2.3%. The recent declines are roughly half the worst from December through March. Medium-sized service payrolls fell 58,000 (-3.7% y/y) and small-sized payrolls dropped 59,000 (-2.9% y/y). Large service producing payrolls dropped by 29,000 (-3.5% y/y).
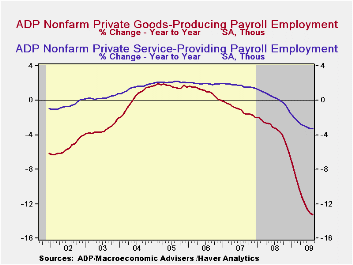
In the goods producing sector there were 152,000 fewer jobs in August (-13.3% y/y). Here, the three-month rate of change eased again, but remained double-digit at -11.2% versus -17.1% at its worst. Small-sized payrolls fell 63,000 (-12.8% y/y) followed by a 58,000 (-13.7% y/y) drop in medium-sized payrolls. Large payrolls fell 31,000 (-13.1% y/y). In the manufacturing sector alone, payrolls fell an easier 74,000 (-12.8% y/y).
The ADP National Employment Report data is maintained in Haver's
USECON database; historical figures date back to December 2000. The figures in this report cover only private sector jobs and exclude employment in the public sector, which rose an average 11,083 during the last twelve months.The full ADP National Employment Report can be found
here and the ADP methodology is explained here.| LAXEPA@USECON | August | July | Y/Y | 2008 | 2007 | 2006 |
|---|---|---|---|---|---|---|
| Total Nonfarm Private Payroll Employment (m/m Chg., 000s) | -298 | -360 | -5.2% | -0.5% | 1.2% | 2.0% |
| Small Payroll (1-49) | -122 | -135 | -4.4 | -0.0 | 1.6 | 2.2 |
| Medium Payroll (50-499) | -116 | -153 | -5.8 | -0.5 | 1.2 | 1.9 |
| Large Payroll (>500) | -60 | -72 | -5.6 | -1.6 | -0.1 | 0.4 |
German Retail Sales Still Short Of Dependable
by Robert Brusca September 2, 2009
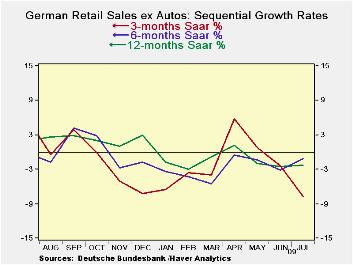
German retail sales edged higher in July but this is after
several months of declining. Despite the minor rise in sales ex-autos,
retail sales in Q3 (one month into the new quarter) are dropping at an
annual rate of 5.7% or 2.7% in real terms. The rise in real retail
sales in July was a much larger 0.7%., not a barn burner but that did
help to blunt the Q3 decline in retail sales compared to their level in
Q2.
Car registration growth turned negative in July to boot after
a bounce in June.
On balance it is clear that Germany is not building its
recovery on the consumer. Its revival, instead, will be a factory-based
export-led affair and will depend on the performance of exports
relative to imports: those trends will be the real keys. But for a
solid recovery to take hold the German consumer will have to be
involved.
As of July, we are still waiting for that to happen.
| German Real and Nominal Retail Sales | QTR | |||||||
|---|---|---|---|---|---|---|---|---|
| Nominal | Jul-09 | Jun-09 | May-09 | 3-MO | 6-MO | 12-MO | Yr-Ago | Saar |
| Retail Ex auto | 0.1% | -1.1% | -1.0% | -7.7% | -1.2% | -2.3% | 2.0% | -5.7% |
| MV and Parts | 0.7% | -1.3% | -1.0% | -6.1% | -1.3% | -1.0% | -1.6% | -2.7% |
| Food Bev & Tobacco | -0.9% | -3.2% | 0.8% | -12.5% | -3.4% | -2.6% | 0.0% | -15.5% |
| Clothing footwear | 2.7% | -0.3% | -1.8% | 2.3% | 8.2% | 2.1% | 1.5% | 11.8% |
| Car registrations (units) | -5.8% | 6.5% | -6.2% | -21.4% | 113.6% | 29.6% | 1.6% | 0.0% |
| Real | ||||||||
| Retail Ex auto | 0.7% | -1.3% | -1.0% | -6.1% | -1.3% | -1.0% | -1.6% | -2.7% |
Jump In 2Q U.S. Worker Productivity Revised Up Slightly & Cost Pressures Eased
by Tom Moeller September 2, 2009
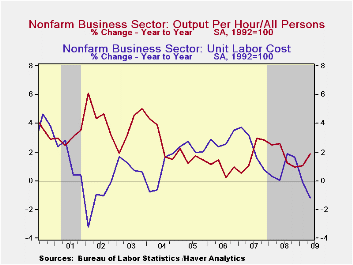
Revisions to the figures on 2Q worker productivity were small and as a result cost pressures continue to show a sharp easing. Labor productivity growth in the nonfarm business sector was revised up slightly to 6.6% (AR) from the initial report of a 6.4% surge. It was the strongest increase since the third quarter of 2003 and the gain beat Consensus expectations for no change in estimated growth.
Compensation costs, however, were revised down sharply. They barely rose at a 0.3% rate after a 4.7% 1Q decline. It was revised down versus the initial report of a 2.4% drop. The recent weak figures leave the y/y increase at just 0.7% which continues the downtrend from roughly 4.0% growth back to 2001.
Last quarter, the surge in productivity and the moderation in
labor cost growth combined to drop unit labor costs. The 5.9% q/q
decline was slightly deeper than reported initially and lowered the y/y
change to -1.2%, the first material negative reading since early-2004.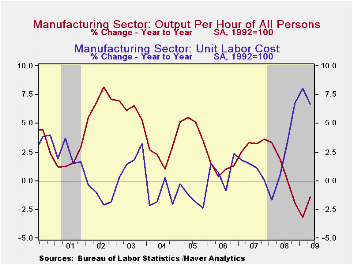
Worker productivity growth in the factory sector was, however, revised down somewhat to 4.9% and that still was the first quarterly increase in over one year. A benefit to workers was seen in a 5.1% rise in 2Q compensation but downward revision to earlier figures lowered the y/y growth to 5.2% from 6.0% reported initially. Nevertheless, the y/y gain was the strongest since late-2003. The combination of strong productivity and firm compensation left the quarterly increase in unit labor cost at a downwardly-revised 0.2%. Still, year-to-year, growth of 6.7% y/y remains a multiple of last year's 2.2% growth.
The productivity & cost figures are available in Haver's USECON database.
Growth Accounting, Potential Output and the Current Recession from the Federal Reserve Bank of San Francisco is available here.
| Nonfarm Business Sector (SAAR, %) | 2Q '09 | 1Q '08 | Y/Y | 2008 | 2007 | 2006 |
|---|---|---|---|---|---|---|
| Output per Hour | 6.6 | 0.3 | 1.9 | 1.8 | 1.9 | 0.9 |
| Compensation per Hour | 0.3 | -4.7 | 0.7 | 2.8 | 4.2 | 3.8 |
| Unit Labor Costs | -5.9 | -5.0 | -1.2 | 1.0 | 2.3 | 2.8 |
U.S. Factory Inventory Decumulation Rate Eases Further
by Tom Moeller September 2, 2009
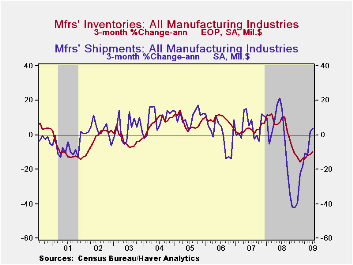
Inventories still are being shed, but at a somewhat slower rate. That is a part of the recent improvement in the level of factory sector output. Manufactures' inventories during July fell 0.7% after a June decline that was revised deeper to 1.1%. These still-significant declines are behind an easing of the decumulation rate to 10.0% from 15.9% this past Winter. Much of that deceleration is due, however, to lower oil prices. Nevertheless, excluding oil, factory inventories fell at a 12.2% three-month rate that was a slight moderation from 14.3% earlier.
The moderation in inventory decumulation rates continues
spotty amongst various industries. Inventories of electrical equipment
& appliances have fallen at a reduced 14.7% rate and machinery
inventories fell at a still-firm 18.7% rate. Conversely, steep
production cuts lowered furniture inventories at a 25.7% rate which was
only slightly reduced. Inventories of primary metals also fell at a
fairly stable 31.3% pace and computer inventory decumulation
accelerated to a 18.1% rate during the last three months.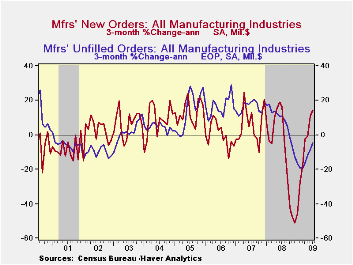
Factory shipments have started to rise moderately. On a three-month basis they're up at a 7.0% rate after the 40% plus rates of decline last Winter. The rate of decline in the machinery industry slowed to 3.1% after dropping at a 52.7% rate in March While in the electrical equipment sector the rate of decline slowed to 7.1% from 48.8%. Most elsewhere the rates of decline in shipments moderated substantially.
Finally, new orders have improved. The 1.3% increase during July was the fifth increase this year. It reflected a sharp monthly rise both in primary metals (-45.0% y/y) and electrical equipment (-20.2% y/y). Unfilled orders also fell at a sharply reduced 4.4% rate through July.
The Manufacturers' Shipments, Inventories and Orders (MSIO) data is available in Haver's USECON database.
Cross-Country Causes and Consequences of the 2008 Crisis: Early Warning from the Federal Reserve Bank of San Francisco can be found here.
| Factory Survey (NAICS, %) | July | June | Y/Y | 2008 | 2007 | 2006 |
|---|---|---|---|---|---|---|
| Inventories | -0.7 | -1.1 | -10.0 | 2.1 | 3.7 | 8.2 |
| Excluding Transportation | -1.1 | -1.4 | -13.1 | -0.6 | 2.7 | 7.9 |
| New Orders | 1.3 | 0.9 | -23.2 | 0.1 | 1.9 | 6.2 |
| Excluding Transportation | -0.7 | 2.7 | -23.2 | 3.1 | 1.2 | 7.4 |
| Shipments | -0.0 | 1.8 | -22.2 | 1.7 | 1.2 | 5.9 |
| Excluding Transportation | -0.1 | 1.9 | -22.4 | 3.7 | 1.5 | 6.7 |
| Unfilled Orders | -0.0 | -0.8 | -10.1 | 3.5 | 17.1 | 15.3 |
| Excluding Transportation | -0.3 | -0.1 | -14.9 | -1.0 | 8.2 | 16.0 |

Tom Moeller
AuthorMore in Author Profile »Prior to joining Haver Analytics in 2000, Mr. Moeller worked as the Economist at Chancellor Capital Management from 1985 to 1999. There, he developed comprehensive economic forecasts and interpreted economic data for equity and fixed income portfolio managers. Also at Chancellor, Mr. Moeller worked as an equity analyst and was responsible for researching and rating companies in the economically sensitive automobile and housing industries for investment in Chancellor’s equity portfolio. Prior to joining Chancellor, Mr. Moeller was an Economist at Citibank from 1979 to 1984. He also analyzed pricing behavior in the metals industry for the Council on Wage and Price Stability in Washington, D.C. In 1999, Mr. Moeller received the award for most accurate forecast from the Forecasters' Club of New York. From 1990 to 1992 he was President of the New York Association for Business Economists. Mr. Moeller earned an M.B.A. in Finance from Fordham University, where he graduated in 1987. He holds a Bachelor of Arts in Economics from George Washington University.
More Economy in Brief


