 Global| Jan 14 2009
The Dismal Christmas: U.S. RetailSales Fell Sharply
by:Tom Moeller
|in:Economy in Brief
Summary
Retail sales in December fell for the sixth consecutive month. Worse yet, the 9.8% year-to-year decline was a postwar record. The 2.7% drop last month followed declines of 2.1% and 3.4% during November and October which were greater [...]
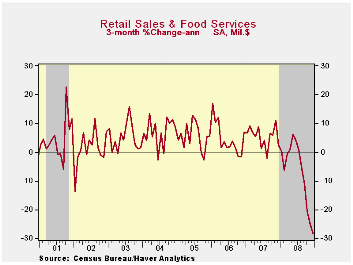
Retail sales in December fell for the sixth consecutive month. Worse yet, the 9.8% year-to-year decline was a postwar record. The 2.7% drop last month followed declines of 2.1% and 3.4% during November and October which were greater than reported initially. Consensus expectations had been for a December sales decline of 1.2%. The retail sales data are available in Haver's USECON database.
Again in December, lower vehicle sales and lower gasoline prices accounted for much of the overall decline in sales. However, even excluding these two areas, sales fell 1.5% and the 0.2% November decline was downwardly revised from the initial report of a slight uptick. Year-to-year, excluding autos and gasoline, sales fell 2.2% which also was a record.
Motor vehicle & parts sales slipped just 0.7% last month but they have declined in all but one month since last November. Year-to-year, dollar sales are down by one quarter. However, that decline is less than the more than one third y/y drop in unit sales of motor vehicles.
Lower prices continued to pull sales at gasoline service
stations lower. Last month they fell 15.9% (-35.5% y/y) after like
declines during the prior two months. That momentum stalled this month
as gasoline prices have ticked slightly higher versus the December
average.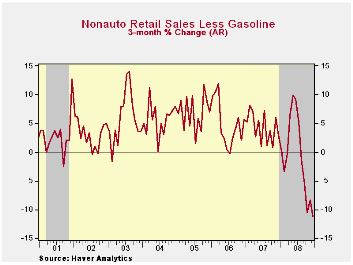
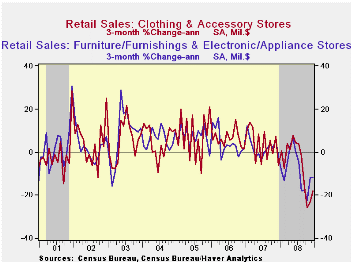
Hard-good sales were notably lower during December. Sales at furniture and electronics & appliance stores took a 1.4% (-8.8% y/y) slide and the 0.4% November uptick was significantly lowered. Furniture store sales fell 1.8% (-13.2% y/y) for their seventh consecutive monthly decline. Sales of electronics & appliances fell 1.0% (-4.2% y/y) after a downwardly revised 1.5% November increase.
In the soft goods area, apparel store sales dropped 2.5% for their fourth sharp monthly decline in the last five months. At general merchandise stores, the news wasn't much better as sales fell 1.3%; however, they posted a year-to-year decline of -0.4%.
Dining out became another casualty of the current recession. Restaurant & drinking place sales fell 2.2% last month and the y/y decline of 0.5% compares to 5.2% growth during 2007. For all of 2008, restaurant sales rose a modest 3.5%.
Building materials sales continue to tumble with the drop off in housing. The 2.9% December drop was similar in size to the declines of the prior two months and it was the fifth consecutive large monthly shortfall.
Sales at nonstore (internet) retailers also have been hit
hard. The 1.9% decline last month (-5.3% y/y) was the sixth in a row.
The Mismeasured Personal Saving Rate Is Still Useful: Using Real-Time Data to Improve Forecasting from the Federal Reserve Bank of Philadelphia can be found here.
Commitment Versus Discretion in Monetary Policy, also from the Federal Reserve Bank of Philadelphia, is available here.
| December | November | October | Y/Y | 2008 | 2007 | 2006 | |
|---|---|---|---|---|---|---|---|
| Retail Sales & Food Services (%) | -2.7 | -2.1 | -3.4 | -9.8 | -0.4 | 4.2 | 5.8 |
| Excluding Autos | -3.1 | -2.5 | -2.9 | -6.7 | 2.7 | 4.6 | 6.8 |
| Less Gasoline | -1.5 | -0.2 | -1.2 | -2.2 | 1.8 | 4.2 | 6.2 |
EMU Industrial Production is Plunging
by Robert Brusca January 14, 2009
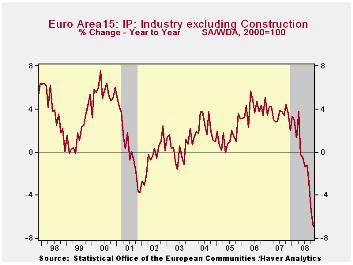
Recession clearly has come to the Euro Area and to its member countries. Industrial output is dropping at a horrendous pace. The sequential growth rates in the table below show that IP has gone from a Yr/Yr decline of 7.1% to declining over six months at a pace of 10.3% and to a drop over three months at minus 19.1%. The unraveling in the EMU is rapid. It is also widespread with consumer durables and consumer nondurables intermediate goods and capital goods all being swept up in the acceleration of the decline. The bottom of the table demonstrates that all the main euro member countries and the UK are greatly affected. The far right column reflects the declines for the special quarter in progress, at this time that is 2008-Q4. The negative impact on growth for the quarter is intense and, again, very widespread.
| Euro Area MFG IP | ||||||||||
|---|---|---|---|---|---|---|---|---|---|---|
| Saar except m/m | Mo/Mo | Nov 08 |
Oct 08 |
Nov 08 |
Oct 08 |
Nov 08 |
Oct 08 |
|||
| Euro Area Detail | Nov 08 |
Oct 08 |
Sep 08 |
3Mo | 3Mo | 6mo | 6mo | 12 mo |
12 mo |
Q-4 |
| MFG | -1.7% | -1.7% | -1.9% | -19.1% | -11.5% | -10.3% | -10.4% | -7.1% | -5.6% | -16.0% |
| Consumer | -0.3% | -0.3% | -0.7% | -4.9% | -5.9% | -2.7% | -6.0% | -3.3% | -3.7% | -5.0% |
| C-Durables | -2.4% | -1.8% | -2.5% | -23.9% | -13.4% | -12.7% | -14.7% | -9.8% | -8.7% | |
| C-Nondurables | 0.1% | 0.0% | -0.8% | -2.6% | -4.3% | -1.1% | -4.2% | -2.2% | -2.7% | |
| Intermediate | -2.8% | -2.4% | -3.1% | -28.5% | -16.5% | -15.6% | -13.9% | -10.3% | -7.7% | -23.5% |
| Capital | -1.8% | -2.3% | -1.9% | -21.8% | -11.5% | -11.4% | -12.4% | -7.2% | -5.1% | -18.1% |
| Main Euro Area Countries and UK IP in MFG | ||||||||||
| Mo/Mo | Nov 08 |
Oct 08 |
Nov 08 |
Oct 08 |
Nov 08 |
Oct 08 |
||||
| MFG Only | Nov 08 |
Oct 08 |
Sep 08 |
3Mo | 3Mo | 6mo | 6mo | 12 mo |
12 mo |
Q-2- Date |
| Germany: | -3.5% | -2.1% | -3.7% | -31.4% | -9.8% | -13.6% | -10.7% | -6.9% | -3.7% | -22.5% |
| France: IP ex Construction | -2.4% | -3.7% | -0.7% | -24.1% | -18.1% | -13.0% | -14.2% | -9.0% | -8.0% | -23.6% |
| Italy | -2.3% | -1.7% | -3.4% | -25.8% | -17.6% | -15.1% | -15.0% | -9.1% | -7.8% | -21.5% |
| Spain | -11.5% | 0.1% | 2.9% | -30.9% | -26.4% | -23.9% | -29.6% | -17.2% | -11.2% | -30.4% |
| UK: EU member | -2.9% | -1.4% | -1.0% | -19.2% | -11.2% | -12.7% | -8.4% | -7.4% | -5.0% | -16.3% |
U.S. Import Prices Down Sharply Again: Both Oil & Nonoil
by Tom Moeller January 14, 2009
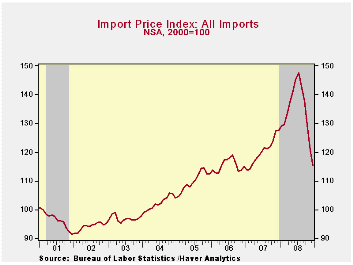
During December, total U.S. import prices declined another 4.2% after the revised 7.0% November drop. The decline fell short of Consensus expectations for a 5.3% decline.
Petroleum prices continued down sharply last month by 21.4%. However, a recent turnaround has lifted imported oil prices by 9.0% versus the December average.
December import prices less petroleum were down for the fifth
straight month. The 1.1% decline lowered them by 13.6% (AR) during the
last three months versus the 12%-to-13% rates of positive growth this
past spring.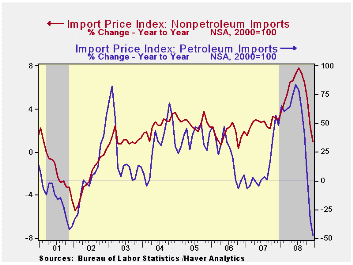
December-to-December, the foreign exchange value of the dollar rose 9.3% and thus reduced the change in U.S. import prices. During the last ten years there has been an 83% (negative) correlation between the nominal trade-weighted exchange value of the US dollar vs. major currencies and the y/y change in non oil import prices.
Capital goods import prices fell another 0.3% and on a three-month basis prices fell at a 3.4% annual rate after a 5%-to-6% rate of increase earlier this year. Less the lower prices of computers, capital goods prices fell 0.2% and the three-month growth rate fell to 1.8% rate over the last three months after 9.0% growth earlier this year. Prices of computers, peripherals & accessories were down at an 8.1% rate during the last three months.
Prices for nonauto consumer goods ticked up 0.1% last month but the three-month rate of change remained a negative 0.8% versus the 5.9% peak earlier this year. Durable goods prices overall fell at a 0.8% rate during the last three months versus a 6.2% rate of increase earlier this year.
Total export prices fell 2.3% due to another sharp decline in agricultural prices. Their 6.5% drop left them down at a 60.2% annual rate during the last three months. Nonagricultural export prices by 1.9% for the fifth consecutive monthly decline.
Troubled Asset Relief Program is yesterday's testimony by Fed Vice-Chairman Donald L. Kohn and it is available here.
| Import/Export Prices (NSA, %) | December | November | Y/Y | 2008 | 2007 | 2006 |
|---|---|---|---|---|---|---|
| Import - All Commodities | -4.2 | -7.0 | -9.3 | 11.6 | 4.2 | 4.9 |
| Petroleum | -21.4 | -28.5 | -47.0 | 38.3 | 11.6 | 20.6 |
| Nonpetroleum | -1.1 | -1.8 | 0.9 | 5.3 | 2.7 | 1.7 |
| Export- All Commodities | -2.3 | -3.4 | -3.2 | 6.0 | 4.9 | 3.6 |
U.S. Business Inventories Fell Further
by Tom Moeller January 14, 2009
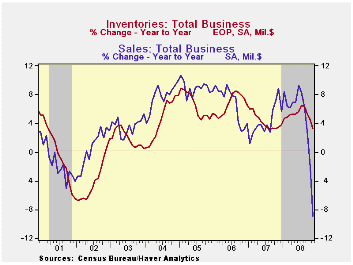 Total business inventories
fell 0.7% during November and it was the
third consecutive monthly decline. Inventories just aren't needed as
sales drop. The 6.6% annual rate of decline in inventories during the
last three months is the swiftest since early 2002. The sales decline
during that period, including the 5.1% November shortfall, was 37.4% at
an annual rate. That mismatch left the inventory/sales ratio surging
upward to 1.41. The November level was the highest since during the
recession of 2001 and the increase in the ratio during the last year is
the swiftest since 1982. The reversal ended a twenty eight year
downtrend.
Total business inventories
fell 0.7% during November and it was the
third consecutive monthly decline. Inventories just aren't needed as
sales drop. The 6.6% annual rate of decline in inventories during the
last three months is the swiftest since early 2002. The sales decline
during that period, including the 5.1% November shortfall, was 37.4% at
an annual rate. That mismatch left the inventory/sales ratio surging
upward to 1.41. The November level was the highest since during the
recession of 2001 and the increase in the ratio during the last year is
the swiftest since 1982. The reversal ended a twenty eight year
downtrend.
Tighter inventory management enabled retailers to buck the
uptrend so inventories fell 1.3% during November. 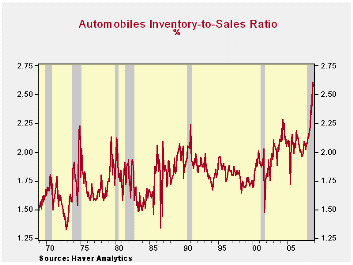 That left the
three-month change at a negative 5.2%. Motor vehicle
inventories have led the decumulation. Down 1.7% during November, they
have fallen at a 9.7% annual rate during the last three months. But
they've got further to fall. The inventory-to-sales ratio for
automobiles has jumped to 2.57 which is by far a historic high. So
unless sales recover soon, expect further production cuts to reduce the
ratio.
That left the
three-month change at a negative 5.2%. Motor vehicle
inventories have led the decumulation. Down 1.7% during November, they
have fallen at a 9.7% annual rate during the last three months. But
they've got further to fall. The inventory-to-sales ratio for
automobiles has jumped to 2.57 which is by far a historic high. So
unless sales recover soon, expect further production cuts to reduce the
ratio.
Outside of autos, retailers have been busy cutting inventory
as
well. Furniture, home furnishings & electronics inventories
fell all of 5.7% in November. 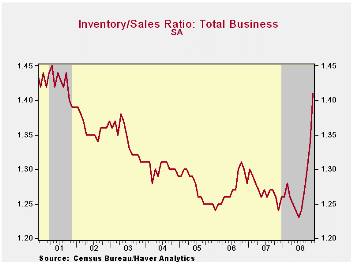 Apparel retailers were busy as
well, but less aggressive. Inventories here fell just 0.3% and they've
been flat for nearly two years. Unfortunately, given the weak
performance of sales the I/S ratio has risen sharply, to its highest
level since 2003. General merchandise inventories fell 0.6%
(-0.6% y/y) and that was been very much enough to keep the inventory
position in good shape.
Apparel retailers were busy as
well, but less aggressive. Inventories here fell just 0.3% and they've
been flat for nearly two years. Unfortunately, given the weak
performance of sales the I/S ratio has risen sharply, to its highest
level since 2003. General merchandise inventories fell 0.6%
(-0.6% y/y) and that was been very much enough to keep the inventory
position in good shape.
| Business Inventories | November | October | September | Y/Y | 2007 | 2006 | 2005 |
|---|---|---|---|---|---|---|---|
| Total | -0.7% | -0.6% | -0.4% | 3.3% | 3.8% | 5.9% | 6.0% |
| Retail | -1.3% | -0.2% | 0.2% | -1.2% | 2.6% | 3.5% | 2.3% |
| Retail excl. Auto | -1.0% | -0.1% | 0.4% | 0.6% | 2.7% | 4.9% | 3.9% |
| Wholesale | -0.6% | -1.2% | -0.4% | 6.3% | 5.5% | 8.3% | 7.3% |
| Manufacturing | -0.3% | -0.6% | -0.8% | 5.1% | 3.7% | 6.4% | 8.9% |

Tom Moeller
AuthorMore in Author Profile »Prior to joining Haver Analytics in 2000, Mr. Moeller worked as the Economist at Chancellor Capital Management from 1985 to 1999. There, he developed comprehensive economic forecasts and interpreted economic data for equity and fixed income portfolio managers. Also at Chancellor, Mr. Moeller worked as an equity analyst and was responsible for researching and rating companies in the economically sensitive automobile and housing industries for investment in Chancellor’s equity portfolio. Prior to joining Chancellor, Mr. Moeller was an Economist at Citibank from 1979 to 1984. He also analyzed pricing behavior in the metals industry for the Council on Wage and Price Stability in Washington, D.C. In 1999, Mr. Moeller received the award for most accurate forecast from the Forecasters' Club of New York. From 1990 to 1992 he was President of the New York Association for Business Economists. Mr. Moeller earned an M.B.A. in Finance from Fordham University, where he graduated in 1987. He holds a Bachelor of Arts in Economics from George Washington University.
More Economy in Brief


