 Global| Oct 26 2006
Surge in U.S. Durable Goods Orders All Air
by:Tom Moeller
|in:Economy in Brief
Summary
Orders for civilian aircraft & parts nearly tripled m/m during September and propelled total new orders for durable goods up 7.8%. That followed a little revised 0.1% dip during August and it beat Consensus expectations for a 2.0% [...]

Orders for civilian aircraft & parts nearly tripled m/m during September and propelled total new orders for durable goods up 7.8%. That followed a little revised 0.1% dip during August and it beat Consensus expectations for a 2.0% increase.
During the last ten years there has been a 69% correlation between the y/y change in durable goods orders and the change in output of durable goods.
The surge in aircraft orders recovered sharp declines that had occurred during four of the prior five months while orders for motor vehicles & parts fell 6.1% (-12.0% y/y).
Durable goods orders less the transportation sector altogether ticked up just 0.1 after a 1.5% August decline. Consensus expectations had been for a 1.0% rise in orders outside of the transportation sector.
Orders for nondefense capital goods less aircraft rose 1.1% after an upwardly revised 0.8% August increase. Orders for machinery rose 1.3% (12.3% y/y) and recovered a 1.1% decline in August that was shallower than initially estimated. Electrical equipment & appliance orders recovered part of the prior month's decline with a 3.7% (0.8% y/y) gain. During the last ten years there has been an 86% correlation between the y/y change in capital goods orders less aircraft and the y/y change in business fixed investment in equipment & software from the GDP accounts.
Orders for computers & electronic products slipped 0.1% (+9.5% y/y) as computer orders fell another 2.3% (-2.4% y/y) on top of the 10.2% August skid. Orders for communications equipment fell 5.3% (+24.6% y/y).
Shipments of durable goods fell 2.8% (+4.2% y/y) and less the transportation sector fell 2.2% (+6.6% y/y). During the last ten years there has been an 82% correlation between the y/y change in durable goods shipments and the change in industrial production of durable goods.
Order backlogs surged 3.8% (21.8% y/y) and less transportation rose 1.1% (13.0% y/y). Unfilled orders for nondefense aircraft & parts jumped 7.0% (53.1% y/y).
Durable inventories rose 1.0% (7.6% y/y) after a 0.6% August rise. Less the transportation sector inventories rose 0.9% (8.3% y/y) after an upwardly revised 1.1% August gain. The inventory to shipments ratio outside of the transportation sector surged to its highest level in over a year.
Modeling the Transition to a New Economy: Lessons from Two Technological Revolutions from the Federal Resesrve Bank of Minneapolis can be found here.
| NAICS Classification | September | August | Y/Y | 2005 | 2004 | 2003 |
|---|---|---|---|---|---|---|
| Durable Goods Orders | 7.8% | -0.1% | 14.1% | 9.0% | 6.4% | -0.6% |
| Excluding Transportation | 0.1% | -1.5% | 6.2% | 9.4% | 7.6% | -1.7% |
| Nondefense Capital Goods | 21.9% | -2.2% | 34.6% | 21.4% | 5.6% | -3.4% |
| Excluding Aircraft | 1.1% | 0.8% | 10.9% | 12.3% | 2.8% | -2.0% |
by Tom Moeller October 26, 2006
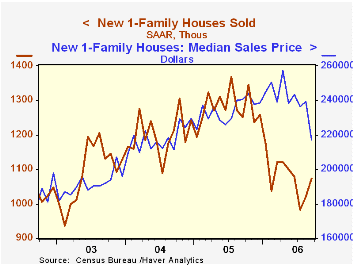
The median sales price of a new single family home fell 9.3% to $217,000 during September. Though the August level of prices was revised up, the year to year change of -9.7% was the worst since 1970 and it lowered prices below the average level of 2004.
Sales of new single family homes sales rose 5.3% during September to 1.075M and exceeded expectations for a gain to 1.040M. Sales in August were revised down moderately.
New home sales during the first nine months of this year are down 15.6% from the first nine months of 2005 and in September were 21.4% below the monthly peak during July 2005.
Sales rose m/m only in the West (-13.6% y/y) and in the South (-7.9% y/y). In the Northeast sales reversed nearly all of the prior month's jump (-6.6% y/y) and in the Midwest sales also fell hard (-36.6% y/y.
The number of new homes for sale edged fell for the second month (+14.4% y/y). The year to year breakdown by region is as follows: Northeast, 11.1%; West, 17.8%; South, 18.2%; Midwest, -1.0%.
| U.S. New Homes | September | August | Y/Y | 2005 | 2004 | 2003 |
|---|---|---|---|---|---|---|
| Total Sales (AR, 000's) | 1,075 | 1,021 | -14.2% | 1,280 | 1,201 | 1,091 |
| Median Price (NSA) | $217,100 | $239,300 | -9.7% | $234,208 | $217,817 | $191,383 |
by Tom Moeller October 26, 2006

Initial claims for unemployment insurance last week rose 8,000 and reversed the little revised 9,000 worker decline during the prior period. At 308,000 claims remained low but up slightly from the lowest levels near 280,000 reached this past January. Consensus expectations had been for 309,000 claims during the latest week.
During the last ten years there has been a (negative) 78% correlation between the level of initial claims and the m/m change in nonfarm payroll employment.
The four-week moving average of initial claims fell to 305,250 (-13.6% y/y).
Continuing claims for unemployment insurance rose 3,000 after a downwardly revised 18,000 increase the prior week.
The insured rate of unemployment was steady at 1.9% where it has been since February.
How Labor Market Policies Shape Immigrants’ Opportunities from the Federal Reserve Bank of Dallas is available here.
| Unemployment Insurance (000s) | 10/21/06 | 10/14/06 | Y/Y | 2005 | 2004 | 2003 |
|---|---|---|---|---|---|---|
| Initial Claims | 308 | 300 | -3.4% | 332 | 343 | 403 |
| Continuing Claims | -- | 2,449 | -12.3% | 2,662 | 2,924 | 3,532 |
by Tom Moeller October 26, 2006
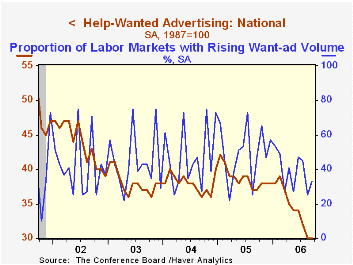
The Conference Board reported that its Index of Help-Wanted Advertising held at 30 in September after having dropped the prior month to a new forty five year low.
During the last ten years there has been a 57% correlation between the level of help-wanted advertising and the three month change in non-farm payrolls.
The proportion of labor markets with rising want-ad volume ticked up to 33% from the one year low of 25% in August.
The Conference Board surveys help-wanted advertising volume in 51 major newspapers across the country every month.
The latest help wanted report from the Conference Board is available here.
| Conference Board | September | August | September '05 |
|---|---|---|---|
| National Help Wanted Index | 30 | 30 | 39 |
by Carol Stone October 26, 2006

It's almost unanimous. Housing is slumping in almost every region of the country. The Census Bureau reported building permit data today for September and the year-to-date for regions, divisions, states and metro areas as well as counties and individual "permit-issuing places", i.e., towns. These data include the number of units, the number of separate buildings and their aggregate value. Haver maintains these in the PERMITY and other PERMIT databases, which are part of our REGIONAL offerings.
As we know, total building permits for the nation have fallen in every month since January; September's were off 5.2% from August (seasonally adjusted) and 31% from a year ago (not seasonally adjusted). Single-family housing permits were down 5.1% from August and 35.6% from September 2005.
The Regional permit data for single-family houses show a year-to-date decline of 13.9% from the comparable period of 2005. Every "division" of the country except "West South Central" has participated in this contraction. The biggest declines in single-family units have been in the Pacific states and the East North Central, both down about 22%. In value terms, the total dollar value of building permits in the Pacific states is down 18.9% and in the East North Central division, 17.8%. The Pacific states include California, Washington, Oregon, Alaska and Hawaii. The East North Central group includes Illinois, Indiana, Michigan, Ohio and Wisconsin.
The West South Central division comprises Arkansas, Louisiana, Oklahoma and Texas. This area is benefiting from the surge in energy prices and is also the subject of much rebuilding effort after last year's hurricanes. This latter effect is not yet fully evident, though; permits in New Orleans are still very low, but they have rebounded in Gulfport-Biloxi, Mississippi and Lafayette, Louisiana. In Texas, the energy factor is a notable stimulus: there are major gains in the Midland-Odessa areas in the West Texas oil fields and also in Houston, Dallas and Waco. Even so, in the West South Central division as a whole, the momentum is flagging. In the East South Central States, which include Mississippi plus Alabama, Kentucky and Tennessee, the number of permits is down slightly and their value is up. For all Census divisions, the value of permits is not as weak as the number, indicating persisting increases in the value per unit. We did not examine the month-by-month data to see if this is ongoing or if it has petered out as the year has worn on for the weakening housing market and as other home price measures show outright declines. Indeed, the year-on-year price declines in national data for new and existing home sales set in just in the last couple of months, so the year-to-date could still be up from last year. This isn't likely to last much longer, though.
| Building Permits, Single-Family Houses, by Division | Type | Year-to-Date Through September||||
|---|---|---|---|---|---|
| 2006 | 2005 | 2004 | 2003 | ||
| New England | Number | 26,518 | 32,563 | 31,764 | 28,359 |
| Value (Mil.$) | $5,239 | $6,251 | $5,790 | $4,852 | |
| Middle Atlantic | Number | 56,757 | 63,581 | 65,702 | 59,903 |
| Value (Mil.$) | $10,100 | $10,902 | $10,318 | $8,820 | |
| East North Central | Number | 117,179 | 150,249 | 149,104 | 145,138 |
| Value (Mil.$) | $21,355 | $25,970 | $24,768 | $22,711 | |
| West North Central | Number | 58,730 | 73,264 | 71,593 | 68,881 |
| Value (Mil.$) | $10,170 | $11,923 | $11,015 | $10,061 | |
| South Atlantic | Number | 345,613 | 399,893 | 357,661 | 312,148 |
| Value (Mil.$) | $59,597 | $64,069 | $52,141 | $42,545 | |
| East South Central | Number | 70,270 | 71,707 | 70,193 | 62,550 |
| Value (Mil.$) | $10,438 | $10,113 | $9,219 | $7,588 | |
| West South Central | Number | 167,220 | 161,940 | 143,032 | 133,465 |
| Value (Mil.$) | $25,323 | $23,021 | $19,373 | $17,180 | |
| Mountain | Number | 142,321 | 173,719 | 162,029 | 134,341 |
| Value (Mil.$) | $26,159 | $29,327 | $25,438 | $19,450 | |
| Pacific | Number | 137,741 | 177,339 | 168,764 | 154,026 |
| Value (Mil.$) | $29,389 | $36,225 | $33,374 | $28,782 |

Tom Moeller
AuthorMore in Author Profile »Prior to joining Haver Analytics in 2000, Mr. Moeller worked as the Economist at Chancellor Capital Management from 1985 to 1999. There, he developed comprehensive economic forecasts and interpreted economic data for equity and fixed income portfolio managers. Also at Chancellor, Mr. Moeller worked as an equity analyst and was responsible for researching and rating companies in the economically sensitive automobile and housing industries for investment in Chancellor’s equity portfolio. Prior to joining Chancellor, Mr. Moeller was an Economist at Citibank from 1979 to 1984. He also analyzed pricing behavior in the metals industry for the Council on Wage and Price Stability in Washington, D.C. In 1999, Mr. Moeller received the award for most accurate forecast from the Forecasters' Club of New York. From 1990 to 1992 he was President of the New York Association for Business Economists. Mr. Moeller earned an M.B.A. in Finance from Fordham University, where he graduated in 1987. He holds a Bachelor of Arts in Economics from George Washington University.
More Economy in Brief


