 Global| Apr 11 2017
Strong Manufacturing PMI but Lethargic IP- What Gives?
Summary
A number of analysts have been showing this sort of chart recently or aggregating 'hard data' vs. 'soft data' and showing the divergence. Well, let me ask you something. If I cut you a slice of orange, would you expect it to taste [...]
 A number of analysts have been showing this sort of chart recently or aggregating 'hard data' vs. 'soft data' and showing the divergence. Well, let me ask you something. If I cut you a slice of orange, would you expect it to taste like an apple? After all, they are both fruit? If the apple did not taste like an orange, would that means that there is 'something wrong with it?' Of course not... diffusion indexes are different than other types of reports, too.
I recently used U.S. IP to explore in more depth the issue of diffusion indexes and IP. I mention that here because this is also an IP index and because diffusion treatments of manufacturing output and other measures are common. But the U.S. IP report is an opportunity to explore an actual index and to find its exact counterpart since that report also contains diffusion indexes of it! There is no service sector index you can do this for, for example. So let me make a few points in general before talking about the specifics of the EMU report (weaker than expected IP in the face of a surging manufacturing PMI!).
Some issues regarding the use of diffusion indexes
1) PMI (diffusion) indexes are gauges that measure breadth not strength and strength is not breadth. While there is a clear statistical correlation there, strength is not breadth and you can imagine a number of occasions when strength and breadth might be good proxies and others when they might not.
2) Diffusion gauges are about period-to-period (usually month-to-month) changes. Yet, they are most frequently compared to year-over-year changes in an index like IP (as I have done above).
3) PMIs are often headline amalgamated gauges while IP is not an index of sector health but is just about output.
4) No matter what the facts since, all these reports are based on surveys it is unlikely that any two surveys even if they ape one another will produce the exact same results. Look in the U.S. at the ADP job survey which is constructed to be a near clone of the private sector portion of the monthly payroll report and yet does not track it all that well month in and month out. Look how different the results are for the U.S. household report and the payroll report which do have methodological and definitional differences but still post surprisingly wildly different result month-to-month.
Breadth is not strength
What is learned in looking at the U.S. IP report in depth is interesting. The U.S. IP report has its own diffusion indexes. We can look at diffusion calculated over several spans using the exact same sample that is used for U.S. IP eliminating one big cause of differences when comparing other data sets. Also we can compare an output survey to an output survey. And yet, the correspondence between diffusion and actual output is rarely all that high in this report. On a sample of data back to January 1999, the IP diffusion level explained only 25% of the variance in the y/y IP gain. The 12-month change in the diffusion index vs. the 12-month percent change in the IP index produced a correlation of nearly zero. The IP diffusion data monthly is a very noisy series, much noisier than the U.S. ISM manufacturing. In fact, the U.S. manufacturing ISM (production index) diffusion gauge has a much better correlation to U.S. manufacturing IP than does the IP report's own diffusion index. This just reconfirms the point that breadth is not strength.
Merge the results of the two reports
In trying to understand the difference in the IP report and the Markit manufacturing index, I suggest that we not dwell on the differences in their messages as if they were a flaw but that we look at them both as complements to try to understand what both series are telling us together. In other words, don't expect an apple to taste like an orange but cut them up together and enjoy the fruit salad.
Learning from both
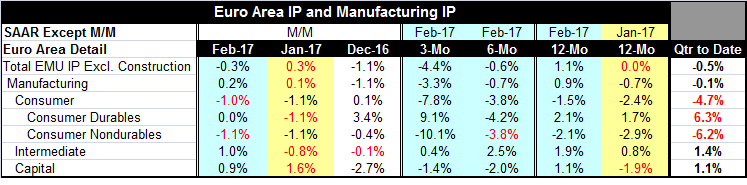
What we see when we give each report its own standing and try to learn from that is that there are broad-based gains in manufacturing according to the PMI. But these are not indications of strength. Look at the EMU report for February. IP is up by only 1.1% over 12 months and output is falling on balance over three months and six months. It may mean that small firms are recovering better than larger firms. It may mean that there are some outsized drops in several sectors that are overpowering the breadth of small gains across 'most' industries. It may just mean that gains are widespread, but they are small. In February alone, euro area output is down for consumer goods but rising for intermediate and capital goods. Those results generate more diffusion cross currents. Across 11 EMU bellwether economies, manufacturing IP is rising in six of them and falling in five of them. That's more cross currents. The current average absolute divergence for this group of 11 member nations, however, is only at its mean; it is actually at its sample norm. So while economists are making a great big deal about this divergence, the underlying IP divergence is quite normal in the EMU. And the divergence of the PMI gauge from the IP simply says that trends are rising in concert and rising more broadly than they are rising strongly.
But aren't the PMIs harbingers?
The PMI's are sensitive gauges. They are also about month-to-month changes so they will stir before the IP gauge does. But just because the diffusion index rises, it doesn't mean that the IP gauge must in any way rise up to fall in line with it. In fact, the normal functioning of the business cycle would be expected to make that happen. But this has been a business cycle with false dawns with step backs and as such we should be wary of deeming something a harbinger. Many incipient trend has not been able to get beyond its own incipiency. In the end, this is just another warning to not count your chickens before they are hatched. Perhaps the problem is that too much has been made of the rising PMI values. The IP report would seem to confirm that. Breath is not strength.
Using PMI signals
Consider the following. If we draw our experience of IP vs. PMI relationships from normal business cycles, we would find that the PMIs (which are month-to-month gauges) will react first and will be reliable indicators of a coming expansion and that year-on-year gain in IP would build strength in the wake of a PMI rise on a regular basis. Since PMIs are monthly gauges, of course they would show improvement first. But suppose we have an abnormal recovery or one with fits and starts and relapses and poor growth all along. In such a period, the PMIs would spark first and give a signal for growth, but the IP gauge might never fall into line with it and the PMI itself would eventually fall back. The PMI signals would prove to be false. So this is what we have to guard against. Basically, the PMI gauges are not indicating recovery independently unless you can be sure that the process will continue and not backslide and, of course, we cannot underwrite such a guarantee because that is what we precisely want to find a gauge to tell us. The longer that the PMI gauge continues to advance and the higher it gets without backsliding on its own, the more likely that the signal may be authentic. So we can still watch the PMIs and use them as Sherpas for the future. But we need to watch them with more skepticism and set the standards for inferring signals from them higher than in the past. We don't simply want to drink the latest PMI Kool Aid and swallow it.

Robert Brusca
AuthorMore in Author Profile »Robert A. Brusca is Chief Economist of Fact and Opinion Economics, a consulting firm he founded in Manhattan. He has been an economist on Wall Street for over 25 years. He has visited central banking and large institutional clients in over 30 countries in his career as an economist. Mr. Brusca was a Divisional Research Chief at the Federal Reserve Bank of NY (Chief of the International Financial markets Division), a Fed Watcher at Irving Trust and Chief Economist at Nikko Securities International. He is widely quoted and appears in various media. Mr. Brusca holds an MA and Ph.D. in economics from Michigan State University and a BA in Economics from the University of Michigan. His research pursues his strong interests in non aligned policy economics as well as international economics. FAO Economics’ research targets investors to assist them in making better investment decisions in stocks, bonds and in a variety of international assets. The company does not manage money and has no conflicts in giving economic advice.
More Economy in Brief


